
This is part 1 in a series on creating a business dashboard in AngularJS.
I'm developing a business dashboard, which I'll be using AngularJS for. Since I'm in the midst of learning AngularJS right now, this is a good opportunity to blog my progress as it goes from concept to prototype to refined implementation. In addition to AngularJS, we'll also be using ASP.NET MVC methods for the back end, to handle matters like authentication and data retrieval.
Here's what we're building in Part 1:
Objective
First off, here are my goals:- A business dashboard with a variety of tiles (counters, KPIs, tabular data, charts)
- Tiles support several colors and sizes
- Tiles can be rearranged by the user, and the user's dashboard layout is remembered
- Tiles can be clicked on to go to a full detail page
- Simple configuration, allowing quick and easy add / change / removal of tiles
- Responsive, able to display well on small phones all the way up to large desktop monitors
Inspiration: Team Foundation Services
Dashboards are a tricky business. I've worked on a number of them, and what often happens is tiles get too ambitious--leading to slow performance, crammed UI, and bloated web pages. In this dashboard, the philisophy is for tiles to show you information, not be workboards in their own right. You can click on a tile to proceed to areas of the software that give you an expanded view with interaction and actions.
My inspiration is to mimic much of the visual design and characteristics of Microsoft's Team Foundation Services dashboard (shown below). While the TFS dashboard is not a business dashboard (it tracks things like bugs, work items, and project progress), there are a number of nice properties of this dashboard that I also want in mine:
- It renders quickly.
- It avoids overly-ambitiious tiles that kill performance and bloat the page. The TFS dashboard designers wisely avoided cramming too much into each tile; when you want more detail and a larger view, you can click through to a page where you perform detailed interaction.
- It is very customizable, in terms of content, coloring, and size--while keeping configuration fields to a minimal number.
- It's responsive, and can be used on a variety of devices and screen sizes

Microsoft Team Services dashboard - my inspiration
Another goal is to do a proper implementation in AngularJS. As I'm still learning Angular--mostly through tutorials, reading, and creating things--I'll undoubtedly have to refactor and refine as I make progress. I'll do my best, though, to follow Google's guidance and conventions as I go.
Solution Structure
We're beginning with a simple ASP.NET project created in Visual Studio with the structure shown below.
Key parts of the solution are these:
- index.html : the default web page, where the dashboard will be rendered
- dashboard.component.js : my Angular dashboard component
- dashboard.template.html : the HTML template for the dashboard component
- dashboard.less : stylesheet
Now let's take a look at these elements to understand what they do.
index.html
Index.html is the HTML page where we'll be rendering our dashboard.Note: if code views aren't showing with syntax highlighting, change your URL from https: to http:.
<!DOCTYPE html>
<html>
<head>
    <title>Dashboard</title>
    <meta charset="utf-8" />
    <link href="http://maxcdn.bootstrapcdn.com/font-awesome/4.7.0/css/font-awesome.min.css" rel="stylesheet" />
    <link href="Content/css/dashboard.css" rel="stylesheet" />
    <script src="Scripts/jquery-3.2.1.min.js"></script>
</head>
<body>
    <div ng-app="dashboard">
        <dashboard id="dashboard"></dashboard>
    </div>

    <script src="Scripts/angular.min.js"></script>
    <script src="app/app.module.js"></script>
    <script src="/components/dashboard/dashboard.component.js"></script>

</body>
</html>
The first thing to note here is that there isn't a lot in the HTML page. Things to pay attention to:1. The page is loading Font Awesome icons, a CSS stylesheet, jQuery, the AngularJS framework, an app.module.js file (which register the Angular app), and a JavaScript file named dashboard.component.js. This last file defines an Angular component named dashboard.
    <link href="http://maxcdn.bootstrapcdn.com/font-awesome/4.7.0/css/font-awesome.min.css" rel="stylesheet" />
    <link href="Content/css/dashboard.css" rel="stylesheet" />
    <script src="Scripts/jquery-3.2.1.min.js"></script>
    ...
    <script src="Scripts/angular.min.js"></script>
    <script src="app/app.module.js"></script>
    <script src="/components/dashboard/dashboard.component.js"></script>
2. The app.module.js file contains a very small amount of JavaScript code to bootstrap Angular in our application.
(function () {
    'use strict';

    // Define the 'dashboard' module
    angular.module('dashboard', [
      'dashboard'
    ]);

})();
3. The markup declares an Angular app (with the ng-app attribute) named dashboard, and includes a <dashboard> element--that's how you invoke an Angular component, as a custom HTML element. This is one of my favorite features of Angular.
<div ng-app="dashboard">
    <dashboard id="dashboard"></dashboard>
</div>
dashboard.component.js
The dashboard.component.js file defines the dashboard component. Ultimately this will grow quite a bit larger as we add functionality. Today, we're just getting started.// Register 'dashboard' component, along with its associated controller and template
angular.
module('dashboard').
component('dashboard', {
templateUrl: '/components/dashboard/dashboard.template.html',
controller: ['$http', function DashboardController($http) {
...
];
...
}]
});
Dashboard Component
The angular.module code registers a dashboard module. A component is added to the module, also named dashboard. (If you'd like a detailed understanding of Angular concepts like apps, modules, and components, take the AngularJS PhoneCat Tutorial, which is how I learned it.)
Let's discuss what the Angular directives in the templates do.

Here's what is actually rendered in the browser by the ng-repeat directive:
Below the markup, there are JavaScript functions to handle drag and drop.
Lastly, we find the controller object in tile_drop and invoke its dragTile method. The dragTile method uses JavaScript's Array.splice method to remove the source tile and insert it where it was dropped. The $apply method is called to update the Angular scope, which triggers automatic updating of the template view. When the model changes, Angular takes care of updating dependent views automatically. Voila, the dashboard is redrawn in its new layout. Because the elements in the tiles array have been shuffled, the internal ids (tile-1, tile-2, etc.) are re-generated.The angular.module code registers a dashboard module. A component is added to the module, also named dashboard. (If you'd like a detailed understanding of Angular concepts like apps, modules, and components, take the AngularJS PhoneCat Tutorial, which is how I learned it.)
angular.module('dashboard', []); // register module

// Register 'dashboard' component, along with its associated controller and template
angular.
  module('dashboard').
  component('dashboard', {
      templateUrl: '/components/dashboard/dashboard.template.html',
      controller: ['$http', function DashboardController($http) {
          var self = this;

          self.dragTile = function (sourceTileIndex, destTileIndex) {
              try {
                  var sourceTile = self.tiles[sourceTileIndex];

                  self.tiles.splice(sourceTileIndex, 1);  // remove source tile from tile list

                  if (sourceTileIndex < destTileIndex) {
                      destTileIndex--;
                  }

                  self.tiles.splice(destTileIndex, 0, sourceTile); // insert dest tile

                  // Regenerate tile ids.
                  var tile;
                  if (self.tiles != null) {
                      for (var t = 0; t < self.tiles.length; t++) {
                          tile = self.tiles[t];
                          tile.id = 'tile-' + (t + 1).toString(); // tile id (tile_1, tile_2, ...)
                      }
                  }

                  var scope = angular.element('#dashboard').scope();
                  scope.$apply(this);
              }
              catch (e) {
                  console.log('dragTile: EXCEPTION ' + e.toString());
              }
          };

          self.title = 'Sample Dashboard';
          self.tiles = [
              { width: 1, height: 1, color: 'red',    title: 'Tile 01' },
              { width: 1, height: 1, color: 'yellow', title: 'Tile 02' },
              { width: 1, height: 1, color: 'green',  title: 'Tile 03' },
              { width: 2, height: 1, color: 'blue',   title: 'Tile 04' },
              { width: 2, height: 2, color: 'purple', title: 'Tile 05' },
              { width: 1, height: 2, color: 'orange', title: 'Tile 06' },
              { width: 1, height: 1, color: 'gray',   title: 'Tile 07' }
          ];

          // Generate tile properties id, sizeClass, bgClass, and classes.
          var tile;
          if (self.tiles != null) {
              for (var t = 0; t < self.tiles.length; t++) {
                  tile = self.tiles[t];
                  tile.id = 'tile-' + (t + 1).toString(); // tile id (tile_1, tile_2, ...)
                  tile.bgClass = "tile-" + tile.color;    // tile background color class (tile-red, tile-yellow, ...)
                  tile.sizeClass = "tile_" + tile.width.toString() + "_" + tile.height.toString(); // tile size class (tile_1_1, tile_1_2, tile_2_1, tile_2_2)
                  tile.classes = tile.sizeClass + ' ' + tile.bgClass; // full list of classes to customize tile appearance
              }
          }
      }]

  });
The dashboard component contains the following:- templateUrl: this is the path to the template file (HTML with Angular directives). When the <dashboard> element in index.html is encountered, the component object is created and renders itself using this template. Our template is named dashboard.template.js.
- controller: this is the code that has the logic and model for the dashboard. An $http variable is passed into the controller, which we'll use down the road to access back-end services. This is an example of Dependency Injection, which is a central concept in Angular.
Dashboard Controller
Most of the code in the JS file involves the controller, so let's look at some of its noteworthy properties:
- self : a copy of this, a reference to the controller instance. It's useful to have a self variable for when JavaScript promise functions are invoked. That will come up in later posts.
var self = this;
- dragTile: a function for drag-and-drop. Well discuss this later in the post.
- title: A title for the dashboard. Right now this is hard-coded; eventually, it will be loaded from a stored dashboard definition.
- tiles: An array of tile definitions. Again, this is hard-coded at present; eventually, the user's tiles, layout, and configuration will be loaded from the application's database. Each tile object has properties that include
- title : a title
- height : logical tile height (1 or 2)
- width : logical tile width (1 or 2)
- color: a color name
- id : unique identifier (tile-1, tile-2, etc.)
- sizeClass : a CSS class for the tile size
- bgClass : a CLS class for the tile's background color.
- classes : all of the CSS classes to be added to the tile (sizeClass + bgClass)
          self.tiles = [
              { width: 1, height: 1, color: 'red',    title: 'Tile 01' },
              { width: 1, height: 1, color: 'yellow', title: 'Tile 02' },
              { width: 1, height: 1, color: 'green',  title: 'Tile 03' },
              { width: 2, height: 1, color: 'blue',   title: 'Tile 04' },
              { width: 2, height: 2, color: 'purple', title: 'Tile 05' },
              { width: 1, height: 2, color: 'orange', title: 'Tile 06' },
              { width: 1, height: 1, color: 'gray',   title: 'Tile 07' }
          ];
This simple, partly hard-coded structure is enough that we can get started on rendering our dashboard.dashboard.template.html
The last code artifact we need to look at is the template for the dashboard controller, dashboard.template.html. This is a small fragment of html that contains Angular directives, and this where the magic happens. The logic and model data in the controller are applied to the directives in the template, yielding output to replace the <dashboard> element in the index.html file.<div class="dashboard-controller">
<div>
<div>{{$ctrl.title}}</div>
<div class="panel">
<div id="tile-{{$index+1}}" ng-repeat="tile in $ctrl.tiles" class="tile"
ng-class="tile.classes"
draggable="true" ondragstart="tile_dragstart(event);"
ondrop="tile_drop(event);" ondragover="tile_dragover(event);">
<div class="hovermenu"><i class="fa fa-ellipsis-h" aria-hidden="true"></i></div>
{{tile.title}}
</div>
</div>
</div>
Angular DirectivesLet's discuss what the Angular directives in the templates do.
- On line 5, we see the ng-repeat directive in use in a div. This will execute a loop, one iteration for each item in the controller's tiles array. The variable tile is the current array item, and $index is the zero-based iteration number.
- The div markup is generated for each dashboard tile. The tile will have ids of the form tile-1, tile-2, etc. because the id parameter is set to the expression tile-{{$index+1}}.
- On the same div element is an ng-class directive. Each tile div starts out with the class tile, but additional CSS classes are needed to control the tile's size and color. ng-class adds additional CSS classes for the tile, based on the classes property of the current tile. Note that we have to use ng-class instead of class so {{tile.classes}}gets evaluated at the right time, when a value is present.
- The tile div contains the title for each tile. The expression in double curly braces {{tile.title}} evaluates to the title for that tile.
- Currently our tiles are simply colored rectangles with a title. There's also an ellipsis (...) that appears in the top right corner if you hover over a tile. That's meant to become a tile action menu.

Tile menu ellipsis appears on hover (future tile menu)
Here's what is actually rendered in the browser by the ng-repeat directive:
<div>
        <div class="ng-binding">Sample Dashboard</div>
        <div class="dashboard-panel">
            <!-- ngRepeat: tile in $ctrl.tiles -->
            <div id="tile-1" ng-repeat="tile in $ctrl.tiles" class="tile ng-binding ng-scope tile_1_1 tile-red" ng-class="tile.classes" draggable="true" ondragstart="tile_dragstart(event);" ondrop="tile_drop(event);" ondragover="tile_dragover(event);">
                <div class="hovermenu"><i class="fa fa-ellipsis-h" aria-hidden="true"></i></div>
                Tile 01
            </div><!-- end ngRepeat: tile in $ctrl.tiles -->
            <div id="tile-2" ng-repeat="tile in $ctrl.tiles" class="tile ng-binding ng-scope tile_1_1 tile-yellow" ng-class="tile.classes" draggable="true" ondragstart="tile_dragstart(event);" ondrop="tile_drop(event);" ondragover="tile_dragover(event);">
                <div class="hovermenu"><i class="fa fa-ellipsis-h" aria-hidden="true"></i></div>
                Tile 02
            </div><!-- end ngRepeat: tile in $ctrl.tiles -->
            <div id="tile-3" ng-repeat="tile in $ctrl.tiles" class="tile ng-binding ng-scope tile_1_1 tile-green" ng-class="tile.classes" draggable="true" ondragstart="tile_dragstart(event);" ondrop="tile_drop(event);" ondragover="tile_dragover(event);">
                <div class="hovermenu"><i class="fa fa-ellipsis-h" aria-hidden="true"></i></div>
                Tile 03
            </div><!-- end ngRepeat: tile in $ctrl.tiles -->
            <div id="tile-4" ng-repeat="tile in $ctrl.tiles" class="tile ng-binding ng-scope tile_2_1 tile-blue" ng-class="tile.classes" draggable="true" ondragstart="tile_dragstart(event);" ondrop="tile_drop(event);" ondragover="tile_dragover(event);">
                <div class="hovermenu"><i class="fa fa-ellipsis-h" aria-hidden="true"></i></div>
                Tile 04
            </div><!-- end ngRepeat: tile in $ctrl.tiles -->
            <div id="tile-5" ng-repeat="tile in $ctrl.tiles" class="tile ng-binding ng-scope tile_2_2 tile-purple" ng-class="tile.classes" draggable="true" ondragstart="tile_dragstart(event);" ondrop="tile_drop(event);" ondragover="tile_dragover(event);">
                <div class="hovermenu"><i class="fa fa-ellipsis-h" aria-hidden="true"></i></div>
                Tile 05
            </div><!-- end ngRepeat: tile in $ctrl.tiles -->
            <div id="tile-6" ng-repeat="tile in $ctrl.tiles" class="tile ng-binding ng-scope tile_1_2 tile-orange" ng-class="tile.classes" draggable="true" ondragstart="tile_dragstart(event);" ondrop="tile_drop(event);" ondragover="tile_dragover(event);">
                <div class="hovermenu"><i class="fa fa-ellipsis-h" aria-hidden="true"></i></div>
                Tile 06
            </div><!-- end ngRepeat: tile in $ctrl.tiles -->
            <div id="tile-7" ng-repeat="tile in $ctrl.tiles" class="tile ng-binding ng-scope tile_1_1 tile-gray" ng-class="tile.classes" draggable="true" ondragstart="tile_dragstart(event);" ondrop="tile_drop(event);" ondragover="tile_dragover(event);">
                <div class="hovermenu"><i class="fa fa-ellipsis-h" aria-hidden="true"></i></div>
                Tile 07
            </div><!-- end ngRepeat: tile in $ctrl.tiles -->
        </div>
    </div>
Drag and DropBelow the markup, there are JavaScript functions to handle drag and drop.
    <script lang="javascript">
        // Handler for start of tile drag.
        function tile_dragstart(ev) {
            // Add the drag data
            ev.dataTransfer.dropEffect = "move";
            ev.dataTransfer.setData("text/plain", ev.target.id);
        }

        // Handler for tile dragover.
        function tile_dragover(ev) {
            ev.preventDefault();
            // Set the dropEffect to move
            ev.dataTransfer.dropEffect = "move";
        }

        // Handler for tile drop.
        function tile_drop(ev, tiles) {
            ev.preventDefault();

            var sourceTileIndex = parseInt(ev.dataTransfer.getData("text").substring(5)) - 1;
            var destTileIndex = parseInt(ev.target.id.substring(5)) - 1;

            var ctrl = angular.element('#dashboard').scope().$$childHead.$ctrl;
            ctrl.dragTile(sourceTileIndex, destTileIndex);
        }
    </script>
</div>
There are a number of ways to do drag-and-drop, including Angular-specific approaches. Here, I've chosen to use what I'm used to: direct HTML5 drag-and-drop. To make this work, there are events for dragstart (start of drag), dragover (mid-drag), and drop (end of action). The start drag and drop functions are passed the current item, which is a tile It's in the drop function that a function in the controller is invoked to rearrange the items in the tiles array.- In tile_dragstart, the id of tile that is being dragged can be identified via event.target.id. The id is saved as data for the drag-and-drop operation, where it will be needed later. The drag cursor is set to a move cursor.
- In tile_dragover, the drag is in progress. The drag cursor is again set to a move cursor.
- In tile_drop, we are ready to rearrange the layout. The saved source tile id is retrieved. The drop target--that is, the destination tile's id--is found at event.target.id. Because the tiles have ids like tile-1, tile-2, etc., the tile index in the controller's tiles array can be found by stripping away the first 5 characters of the id and subtracting one.
          self.dragTile = function (sourceTileIndex, destTileIndex) {
              try {
                  var sourceTile = self.tiles[sourceTileIndex];

                  self.tiles.splice(sourceTileIndex, 1);  // remove source tile from tile list

                  if (sourceTileIndex < destTileIndex) {
                      destTileIndex--;
                  }

                  self.tiles.splice(destTileIndex, 0, sourceTile); // insert dest tile

                  // Regenerate tile ids.
                  var tile;
                  if (self.tiles != null) {
                      for (var t = 0; t < self.tiles.length; t++) {
                          tile = self.tiles[t];
                          tile.id = 'tile-' + (t + 1).toString(); // tile id (tile_1, tile_2, ...)
                      }
                  }

                  var scope = angular.element('#dashboard').scope();
                  scope.$apply(this);
              }
We'll see all of this in action shortly.dashboard.less
We have one last file to examine, our CSS rules./* Dashboard Styles */
/* panel of tiles */
.dashboard-panel {
width: 100%;
height: 100%;
padding: 16px;
}
/* tile */
.tile {
display: inline-block;
position: relative;
width: 200px;
height: 200px;
top: 0;
margin-top: 0;
margin-right: 16px;
margin-bottom: 16px;
padding: 16px;
background-color: #DDDDDD;
color: white;
font-family: roboto, Arial, Helvetica, sans-serif;
font-size: 18px;
}
/* 1x1 tile */
.tile_1_1 {
width: 200px !important;
height: 200px !important;
}
/* 2x1 tile*/
.tile_2_1 {
width: 448px !important;
height: 200px !important;
}
/* 1x2 tile */
.tile_1_2 {
width: 200px !important;
height: 420px !important;
}
/* 2x2 tile */
.tile_2_2 {
width: 448px !important;
height: 420px !important;
}
/* tile colors */
.tile-gray {
background-color: #DDDDDD !important;
color: black !important;
}
.tile-red {
background-color: #E60017 !important;
}
.tile-orange {
background-color: #DB552C !important;
}
.tile-blue {
background-color: #009CCC !important;
}
.tile-green {
background-color: #339947 !important;
}
.tile-yellow {
background-color: #FBFD52 !important;
color: black !important;
}
.tile-purple {
background-color: #5C197B !important;
}
.tile-container {
display: inline-block;
}
.hovermenu {
position: absolute;
right: 0;
top: 0;
display: block;
width: 24px;
height: 24px;
vertical-align: middle;
text-align: center;
color: transparent;
}
.hovermenu:hover {
display: block;
color: white;
}
.bigtext {
font-size: 72px;
}
The CSS rules are very simple right now:- dashboard-panel : applied to the div containing the dashboard tiles
- tile : applied to every tile
- tile_1_1, tile_1_2, tile_2_1, tile_2_2 : styles that change the size of a tile.
- tile_red, tile_yellow, tile_blue, etc. : styles that set a tile's color
- hovermenu : style that makes the tile menu ellipsis (...) apper when hovered over
Running the Code
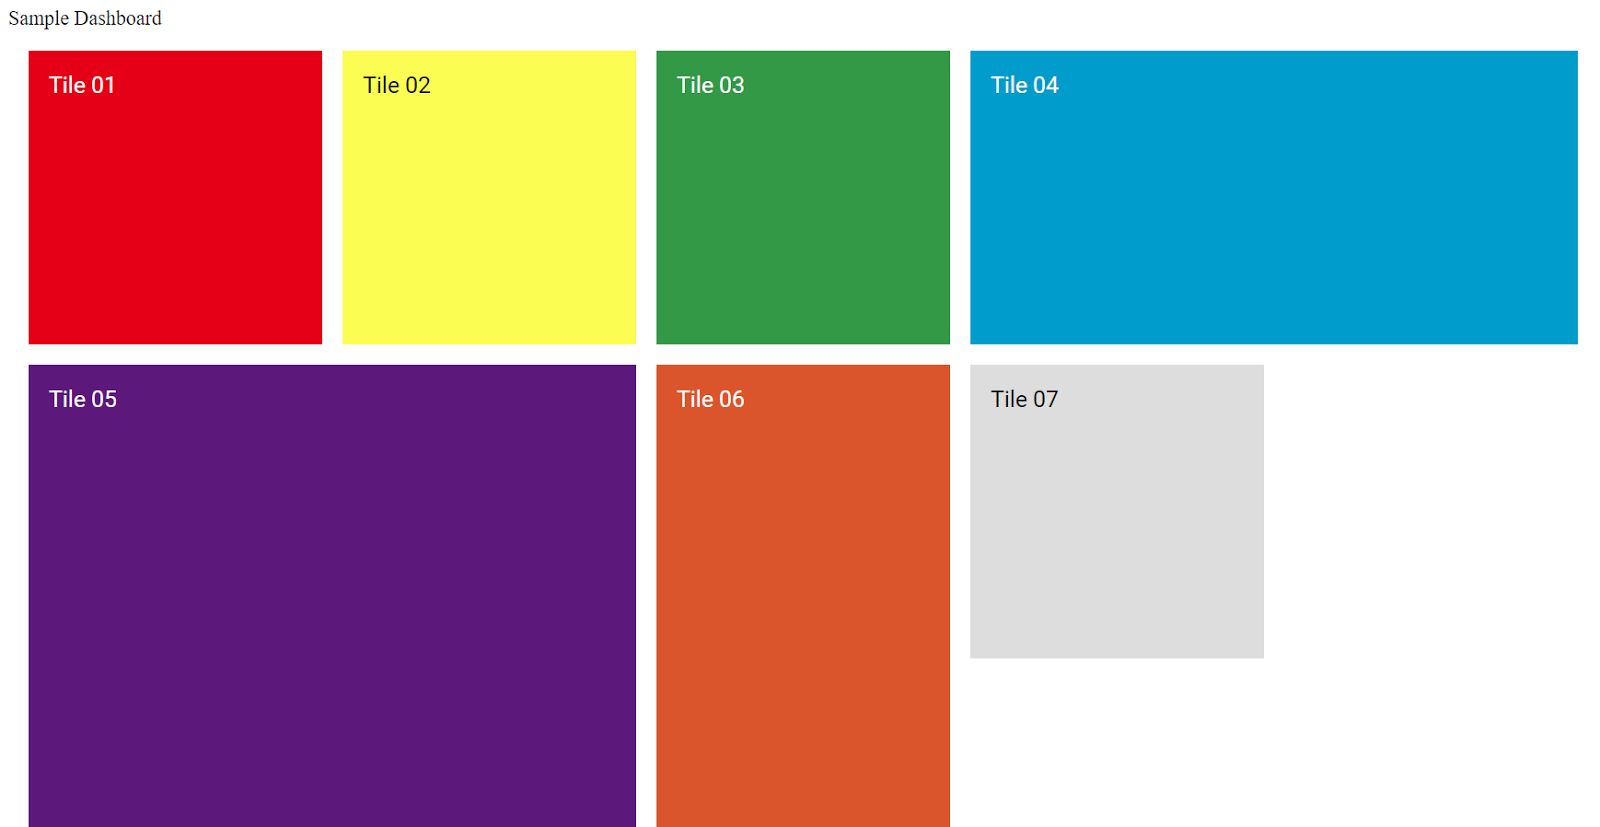
Now we're ready to try things out. When we run the above code, we get a beginning dashboard rendered.
Dashboard - desktop size window
Let's review what happened when the index.html page was loaded:
- The browser loaded the referenced CSS and JavaScript files, including AngularJS and our code for the dashboard component.
- The app.module.js code registered the Angular module and dashboard component .
- The
markup in the page was rendered as a dashboard component by Angular. This included using the dashboard.template.html as a template and executing its directives. The model data in the dashboard controller furnished the dashboard title and tile definitions, which were rendered in a loop by the ng-repeat directive.
- A simple JavaScript item collection is rendered as a dashboard
- Tiles are rendered in the size and color of their definition
- Whether on a large or small screen, the tiles will responsively arrange themselves to fit
- Tiles can be dragged and dropped to rearrange the layout
There's more work to be done to make this a great responsive dashboard, but the tiles across will fill based on available screen size. If we make the browser window smaller to approximate a smaller device such as a tablet, the tile layout changes to fit.

Dashboard - tablet size window
Drag and DropLet's test our drag-and-drop functionality. We'll begin dragging tile 4, the wide blue one at the top right, to the left. As we drag, we get a ghost image of the source tile.

Dashboard during Drag
We'll release the drag over tile 2, the yellow tile second from left. When we do, the dashboard rearranges itself. The drop handler invokes the dashboard controller's dragTile function, which removes and inserts the blue tile in the tiles array. When the code applies its changes to the Angular scope, the page is automatically updated with the new tile layout.

Dashboard after Drop
Changing the DashboardThanks to way this is all wired together with Angular, it's quite simple to change the dashboard. If we modify the tile definitions in the controller's tiles array and refresh the page, we'll get a very different dashboard:
          self.title = 'Events Dashboard';
          self.tiles = [
              { width: 1, height: 1, color: 'green',    title: 'Revenue-New York' },
              { width: 1, height: 1, color: 'green', title: 'Revenue-Los Angeles' },
              { width: 1, height: 1, color: 'red',  title: 'Expenses-New York' },
              { width: 1, height: 1, color: 'red',   title: 'Expenses-Los Angeles' },
              { width: 2, height: 2, color: 'blue', title: 'Location Ranking' },
              { width: 1, height: 2, color: 'purple', title: 'Employee Performance' },
              { width: 1, height: 1, color: 'orange',   title: 'Problem Reports' }
          ];

Dashboard with new definitions
Summary
My dashboard is on its way, and doing it in Angular seems to be proceeding well. Angular is giving us a nice separation of concerns. Implementing the dashboard as a component has made it easy to add a dashboard to a page, simply by adding a <dashboard> element.Much of Angular is elegant, but like any web framework there are areas that are non-obvious, difficult, or contain gotchas. In this lesson, I experienced two of these:
- It took me a while to find a way to make drag and drop work in concert with the Angular controller, because I wasn't sure how to get to it. What I have now is working, but I'll be looking for a better way to handle that at some point that feels less kludgey.
- Setting styles for tiles took some time to figure out, until I started using ng-class insted of class.
Download Source
dashboard_01.zip
https://drive.google.com/open?id=0B4734rvcufGGUTVfT2Fqa0E1dVU
Next: AngularJS Dashboard, Part 2: Counter, Table, Donut Chart, and Column Chart Tiles