Sunday, October 15, 2017

An AngularJS Dashboard, Part 4: Bar/Pie Charts and Back-end Data Queries

NOTE: for best results, view the http: version of this page (else you won't get syntax highlighting).

This is Part 4 in a series on creating a dashboard in AngularJS. I'm blogging as I progressively create the dashboard, refining my Angular experience along the way.

Previously in Part 3, we added a KPI tile, improved on our tile rendering algorithm, and implemented a data service. The data service communicates with a partially-done back end to retrieve dashboard layout.

Today, we're going to:
  1. Add two more chart tiles (bar chart and pie chart).
  2. Build out more of our back end so that tile data is actually queried from the database. 
  3. Do some refactoring and fixing of existing code.
Here's what we'll be ending up with:


But First, Some Refactoring

We've been moving pretty rapidly as we protoype more and more of our dashboard, and whenever that's the case it's important to step back from time to time and take stock. There are a few things in our code we'd like to fix or refactor.

Fixing Drag-and-Drop

One of those areas is drag-and-drop. We implemented that right out of the box in Part 1, before we had even implemented any of our tiles. Since then, however, we've made all sorts of changes to our template and our controller; as well as changing our tile rendering approach to use an HTML table. Just where does this leave drag-and-drop? Having tested it out after Part 3, it's only partially working. Sometimes it's not re-rendering the dashboard after a drop. Clearly some refinement to our drag-and-drop code is needed.
// Handler for start of tile drag.
function tile_dragstart(ev) {
    ev.dataTransfer.dropEffect = "move";
    var sourceId = getParentTileId(ev.target);
    if (sourceId != null) {
        ev.dataTransfer.setData("text/plain", sourceId);
    }
    else {
        ev.stopPropagation();   // tile not found - stop drag
    }
}

// Handler for tile dragover.
function tile_dragover(ev) {
    ev.preventDefault();
    ev.dataTransfer.dropEffect = "move";
}

// Handler for tile drop.
function tile_drop(ev, tiles) {
    ev.preventDefault();
    var destId = getParentTileId(ev.target);
    if (destId != null) {
        var sourceTileIndex = parseInt(ev.dataTransfer.getData("text").substring(5)) - 1;
        var destTileIndex = parseInt(destId.substring(5)) - 1;
        var ctrl = angular.element('#dashboard').scope().$$childHead.$ctrl;
        ctrl.dragTile(sourceTileIndex, destTileIndex); // make the drag happen in the tile layout, and re-rended the dashboard
        deferCreateCharts();    // re-render the charts, too.
    }
    else {
        ev.stopPropagation();   // tile not found, cancel drop
    }
}

// Given a drag element (which may or may not have an Id, and which may or may not be in a tile), 
// return the tile Id that contains it. Or null, if not in a tile.
function getParentTileId(element) {
    var ctrl = angular.element('#dashboard').scope().$$childHead.$ctrl;
    for (var t = 1; t <= ctrl.tiles.length; t++) {
        if (document.getElementById('tile-' + t.toString()).contains(element)) {
            return 'tile-' + t.toString();
        } // end if
    } // next t
    return null;
}
Recalling that we added the computeLayout function to the controller in Part 3, the controller's dragTile function now also invokes computeLayout. That ensures the updated dashboard HTML now always gets rendered. In the drop event handler we also call deferCreateCharts, which has the controller invoke the ChartService to run the JavaScript code needed to render the chart tiles. With these changes, drag-and-drop is happy once again. We can freely drag and drop tiles and now we're getting the expected experience. We'll need to check how well this is working on mobile devices, but for the desktop we're happy.

Result: drag-and-drop is now working beautifully

Tile Rendering

Although we improved tile rendering in Part 3 (through the use of dynamically-computed tiles-across and use of an HTML table), the use of colspan didn't quite give us the economy of layout we expected. It turns out the HTML table will do a smarter job of rendering table cells and colspan attributes if we tell it how many columns there are going to be, using <colgroup> and <col> elements (line 6).
<div class="dashboard-controller" window-size>
    <div>
        <div>{{$ctrl.title}} (chart provider: {{$ctrl.chartProvider}} | data provider: {{$ctrl.dataProvider}})</div>
        <div class="dashboard-panel">
            <table>
                <colgroup><col width="200px" ng-repeat="unit in $ctrl.tileunits"></colgroup>
                <tr ng-repeat="row in $ctrl.layoutView track by $index">
                    <td ng-repeat="tile in row" colspan="{{tile.width}}">
                        <div id="tile-{{tile.id}}"
                             class="tile" ng-class="tile.classes"
                             style="overflow: hidden"
                             draggable="true" ondragstart="tile_dragstart(event);"
                             ondrop="tile_drop(event);" ondragover="tile_dragover(event);">
As powerful as ng-repeat is, it can't execute a simple for loop. This posed a problem in getting the right number of <col> elements emitted. Ultimately, I had to add a tileunits array to the controller, updated by configLayout (lines 30-33).
angular.module('dashboard').component('dashboard', {
    templateUrl: '/components/dashboard/dashboard.template.html',
    controller: [
        '$scope', '$window', '$http', 'ChartService', 'DataService', function DashboardController($scope, $window, $http, ChartService, DataService) {
            var self = this;
            var ctrl = angular.element('#dashboard').scope().$$childHead.$ctrl;

            self.chartProvider = ChartService.chartProvider();
            self.dataProvider = DataService.dataProvider();

            self.tilesacross = 2;       // number of tile units across - set dynamically as window size chnges
            self.tileunits = [1, 2];    // used by template to render table <col> elements.

            self.tablecolumns = function () {
                return $scope.tablecolumns;
            }
            ...
            // Compute layout based on current screen dimensions (self.tablecolumns()) and generate updated tile layout
            // Inputs: self.tablecolumns() ........... number of tiles across.
            // Ouptuts: self.layoutView .............. updated array of tile rows, each element an array of tiles for a row [[ tile1, ... tileN ], ... [ tileX, ... tileZ ] ]

            self.computeLayout = function () {
                if (self.tiles == null) return;

                var numcols = self.tablecolumns();
                if (numcols < 1) numcols = 1;

                // This is used in template to render things like table <col> elements.
                self.tilesacross = numcols;
                self.tileunits = [];
                for (var u = 0; u < numcols; u++) {
                    self.tileunits.push(u);
                }

                var newlayout = [];
                ...
Controller with tileunits property added

By adding <col> elements to our HTML template, we're already getting a smarter rendering by the browser--and we haven't even added any smart fill logic yet.

Result: dashboard layout with a mixture of tile widths is now rendering much better.

Formatted Tile Values

For some tiles, like charts, we need to provide numeric values--but often we want those values formatted, for example with currency formatting such as $150.00. We're adding a new optional property to tile named format. If format is present, it is expected to contain a string with an embedded {0}. The {0} will be replaced with the data value. This gives us a simple way to have format masks, as in '${0}'. We'll see if we can make that more sophisticated over time.

We've updated the GoogleChartProvider class to take tile.format into consideration for column charts. Now, we see money represented properly on the bars. If we find other opportunities for formatted values, we now have the format property available in the tile.


Result: GoogleChartProvider column chart tiles now support formatted values

Tile Links

Early on in this series, we made the point that the intent of the dashboard was informational, and that the place to go and do work (advanced sorting/searching, interaction, data changes) was in the application pages that these tiles would link to. We haven't done anything to make tiles linkable yet, so we'll do that now. All it takes are two easy changes: 1) adding a new link property to our tile definitions, and 2) including an anchor tag in our tile rendering. The link property contains a URL, and the template changes are below (lines 26 and 30).

<div class="dashboard-controller" window-size>
    <div>
        <div>{{$ctrl.title}} (chart provider: {{$ctrl.chartProvider}} | data provider: {{$ctrl.dataProvider}})</div>
        <!--<span after-render="deferCreateCharts"></span>-->
        <div class="dashboard-panel">
            <table>
                <colgroup><col width="200px" ng-repeat="unit in $ctrl.tileunits"></colgroup>
                <tr ng-repeat="row in $ctrl.layoutView track by $index">
                    <td ng-repeat="tile in row" colspan="{{tile.width}}">
                        <!-- Placeholder Tile (data not loaded) -->
                        <div id="tile-{{tile.id}}" ng-if="!tile.haveData"
                             class="tile" ng-class="tile.classes"
                             style="overflow: hidden"
                             draggable="true" ondragstart="tile_dragstart(event);"
                             ondrop="tile_drop(event);" ondragover="tile_dragover(event);">
                            <div class="hovermenu"><i class="fa fa-ellipsis-h" aria-hidden="true"></i></div>
                            <div style="overflow: hidden; white-space: nowrap">{{tile.title}}</div>
                            <div style="position: relative; height: 100%"></div></div>
                        <!-- Populated tile (data loaded) -->
                        <div id="tile-{{tile.id}}" ng-if="tile.haveData"
                             class="tile" ng-class="tile.classes"
                             style="overflow: hidden"
                             draggable="true" ondragstart="tile_dragstart(event);"
                             ondrop="tile_drop(event);" ondragover="tile_dragover(event);">
                            <div class="hovermenu"><i class="fa fa-ellipsis-h" aria-hidden="true"></i></div>
                            <a ng-href="{{tile.link}}" style="color: inherit; text-decoration: inherit;">
                            <div style="overflow: hidden; white-space: nowrap">{{tile.title}}</div>
                            <div style="position: relative; height: 100%">
                            ...tile markup...
                            </a>
                        </div> <!-- end tile -->
                    </td>
                </tr>
            </table>
        </div>
    </div>
dashboard.template.html Changes to Support Tile Linking

Our template HTML has been updated to output an a tag with ng-href. The effect of this is a tile will transfer to the defined application page when clicked, and we'll get an automatic hand cursor over the tile on hover. Tiles without a link property won't go anywhere when clicked.

Our sample application is not a real application, but we'll add some mock application pages under /App/Customers, /App/Orders, etc. so we can see the tile link feature in action when we run the code. For this reason, you'll see an MVC AppController.cs and a /Views/App folder in the solution with dummy pages /App/Customers, /App/Stores, /App/Orders, and /App/Employees.

Result: GoogleChartProvider column chart tiles now support formatted values

This is probably a good time to review the properties that can now exist in a tile:

color    background color (red, orange, yellow, green, cyan, blue, purple, gray)
columns    An array of column information for the tile
dataSource    The name of the query for retrieving tile data
height    tile height (1 or 2)
label    A display value used by some tile types
link    The URL the tile links to when clicked
title    the tile's display title
type    the type of the tile (counter, bar, column, donut, kpi pie, table)
width    tile width (1 or 2)
value    Value(s) to show in the tile

New Bar Chart Tile

Two posts ago, we added some chart tiles--a donut chart and a column (vertical bar) chart--implemented with a choice of two different chart libraries (Google Visualization and Chart.js). These libraries can generate many kinds of charts, so we want to regularly add additional chart tiles as we move forward. Today we'll add a bar chart, a horizontal edition of the column chart we already have.

These are the steps needed to implement the bar chart tile:

1. Define a new tile type of 'bar'. Aside from the type, this tile structure will be identical to the 'column' tile created in Part 2.
2. In the template, add markup with ng-if conditions of chartProvider equals Google' and type equals 'bar'. This will otherwise be identical markup to the column tile, except that the class will be 'barchart'.
3. Add code to the controller's createCharts function to scan the DOM for elements in class 'barchart' and invoke ChartService.drawBarChart() to render the charts.
4. In the Google Chart Service (google.chart.service.js), add new function drawBarChart(). The implementation is practically identical to drawColumnChart(), except the call is to google.visualization.BarChart(...) instead of .ColumnChart(...).
5. Repeat steps 2-4 for the Chart.js chart provider. The new drawBarChart() function is practically identical to drawColumnChart(), but we tell Chart.js the chart type is 'horizontalBar' instead of 'bar'.

All of this is very simple because we're simply following the same pattern already established for the column chart tile. With this work done, we'll update our demo.data.service.js definition of the Precious Metals tile so its type is now 'bar' instead of 'column'. After clearing cache and running the project with the Google chart provider enabled, here's what we get. This looks pretty good.

Bar Chart rendered by Google Visualization API

Now, we switch to the Chart.js chart provider (by commenting out the Google script elements and uncommenting the Chart.js script elements in index.html). This time, we get a bar chart from Chart.js that looks very good. To make the bar charts more similar, we'd like to find a way to show bar values on the bars in the Chart.js version--but we're still working on that.

Bar Chart rendered by Chart.js

All in all, that was pretty easy. Let's do one more chart tile.


New Pie Chart Tile

In the same way, we can easily create a pie chart tile since we already have a donut tile in place. THe only difference between a pie chart and a donut chart is the hole taken out of the center of the donut chart. 

These are the steps needed to implement the pie chart tile:

1. Define a new tile type of 'pie'. Aside from the type, this tile structure will be identical to the 'donut' tile created in Part 2.
2. In the template, add markup with ng-if conditions of chartProvider equals 'Google' and type equals 'pie'. This will otherwise be identical markup to the donut tile except that the class will be 'piechart'.
3. Add code to the controller's createCharts function to scan the DOM for elements in class 'piechart' and invoke ChartService.drawPieChart() to render the charts.
4. In the Google Chart Service (google.chart.service.js), add new function drawPieChart(). The implementation is practically identical to drawDonutChart(), except there is no donut center section (pieHole: 0.4) property defined in the structure handed to the API.
5. Repeat steps 2-4 for the Chart.js chart provider. We tell chart.js the chart type is 'pie' rather than 'donut'.

Again, very straightfoward because we're following an established pattern. With this work done, we'll update our demo.data.service.js definition of the Time Managements tile so its type is now 'pie' instead of 'donut'. After clearing cache and running the project with the Google chart provider enabled, here's what we get. 

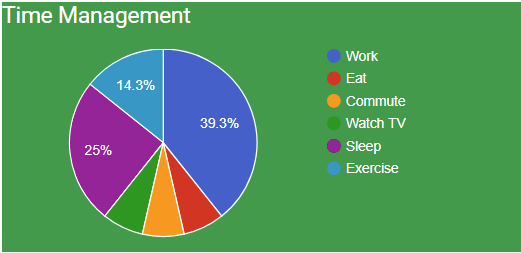
Pie Chart rendered by Google Visualization

Pie Chart rendered by Chart.js

Now we have 4 kinds of chart tiles available in the dashboard (donut, pie, column, bar), each with a dual implementation based on which ChartService you enable. We'll continue to add more chart types over time.

Expanding the Back End for Live Application Data

In part 3, we started our back end: we created a Dashboard database with dashboard layout tables, created a sister SqlServerDataService alternatuve to the DemoDataService, and an ASP.NET MVC controller for database actions. All of that got us database-based dashboard layout. However, the data on the tiles is still just sitting in the tile definitions (properties like value, columns, and label).

Our next step, then, will be to retrieve tile data from application tables. To make this happen, we'll be doing the following:
  1. Define a DashboardTile reference table, with one entry for each type of dashboard tile.
  2. Define some application data (tables like Employee, Store, Customer, and Order).
  3. Define a DashboardQuery table for holding available data queries for dashboard tiles.
  4. Revise MVC DashboardController.Index action to execute queries to fecth tile data. .
  5. Update the SqlServerDataService's getTileLayout function to call the back-end Query action to get data for each tile.

New DashboardTile Table

Although we already have a DashboardLayoutTile table that lists the tile in a particular dashboard layout, we don't have a reference table of the available tile types--which will be crucial later on when we add UI for adding new tiles. Each tile definition will include:
  • TileType : this value is the same as tile.type we've had in our tile structure all along. So far, it can have these possible values: counter, donut, pie, bar, column, table, kpi.
  • TileName : the name for the type of tile, such as "Pie Chart".
  • PropertyNames : a string containing a list of properties the tile requires, separated by a vertical bar. For example: type|title|width|height|color|dataSource|columns|value
  • ValueType : a string explaining the type of value the tile needs. 
ValueType needs some explanation. We've already seen that different tiles take different kinds of values--all the way from a counter tile that expects a simple number like 15, all the way to a table tile that requires an array of arrays. In addition, for some tile types the data source query also needs to set additional tile values such as label or columns. In order to safeguard against bad combinations of data source query and tile type, we need to know what kind of query (or queries) each tile expects, and that's what ValueType is. Possible values right now are:
  • number: a single number. Example: value: 5
  • number-array: an array of numbers. Example: value: 1, 6, 7, 10, -4.3
  • table: an array of rows, where each row is an array of column values. Example: value: [ [ 'Mike', 10000, true ], ['Jim,' 8000, false ] ... ] | The back end will also set the tile's columns property, base on the column names and types in thre result set. Example: columns: [['Name], 'string], [Salary', 'number:'] ... ]
  • kpi-set: a single numeric value; a label for the value; and an array of four column names. Example: value: 50 | label: $7,500 | columns: $0, $5K, $10K, $15K

DashboardTile table defining Available Tile Types

With these definitions, we'll be able to implement a safe configuration UI for the tiles. We won't be creating that UI today, but we've laid the foundation for it.

Defining Application Data

To simulate some actual application data in our sample project, we'll add these new tables to our sample database and populate them:
  • Employee : table of employees (EmployeeId, Lastname, Firstname, Title, Startdate IsActive, ManagerEmployeeId)
  • Store: table of store locations (StoreId, StoreName, ManagerEmployeeId, Street, City, State, PostalCode, Country, Phone)
  • Customer : table of customers (CustomerId, Street, City, State, Country, PostalCode, Country, Phone)
  • Order : table of orders (OrderId, StoreId, CutomerId, OrderDate, Subtotal, Tax, Total, IsOpen, ShipDate)
The T-SQL to create these tables and populate them is included in the same project script file dashboard_database.sql. Here's our mock application data. It's not much, but it's enough for us to build out running actual data queries to populate our tiles.

Mock Application Data Added to Database

New DashboardQuery Table

Next, we'll add a table of dashboard queries. Each record in DashboardQuery will contain:

  • Name : A friendly name. When we later implement the UI for tile configuration, we'll need to present the user with a friendly list of available data.
  • ValueType : A value type, indicating what kind of value the query brings back. These are the same ValueType values described earlier above for the DashboardTile table (number, number-array, table, etc). 
  • Query : The T-SQL query to run.
Note that the query in Query must return data in the form expected by ValueType. That is, if ValueType is 'number', the query should return a single numeric value; if ValueType is 'number-array', the query should return a sequence of numbers; and so on. 

Here is our initial DashboardQuery data--with more to come.

DashboardQiuery Table

Now that we have some queries defined, we're going to update some of our tile definitions in the DashboardLayoutTileProperty table. Previously, the dataSource property for each tile was 'Inline'. Now, we're going to update our tile definitions to use some of the above queries. Below is our updated llst of tiles in the DashboardLayout tables.


Dashboard Layout (DashboardLayoutTileProperties)

Notice we no longer have value or columns properties defined for our tiles--these will come from querying the data sources when the dashboard is loaded.

Tile Validation and Data Separation

Up until now, a tile definition also included its data--they were provided in value and other properties right when the rest of the tile was defined. Our Angular DashboardController would call the DataService.getTileLayout() function to retrieve an array of tile definitions, including the data.

We now want to separate the tile definition from the tile data, and have the data loaded from elsewhere (such as the Order table). For now, we'll still make the single call to DataService.getTileLayout(), but we're going to change how that function works. In the DataSevice, we won't be changing anything--but in the MVC back-end that returns the collection of tiles, we'll now be querying the database to get the tile data.

To start on that path, we'll first be adding a new property to each tile named haveData. This is an internal property that can be true or false. If false, the tile does not yet have data. We've modified the template to show a ghost tile that is empty and in gray (regardless of its assigned color) when there's no data. When tile.haveData is true, the tile will render as usual.

We have a second use for haveData: we'll set it to false if we don't think a tile has a correct and complete structure. Each of our tiles has a slightly different mix of properties, and some of those (like value) have expected structures that vary from one tile type to another. What we don't want is for one incorrect tile to kill rendering of the entire dashboard. So, we're going to add some correctness checks in our controller's initialization code, right after it retrieves the tile definitions from the Data Service. If a tile doesn't look right, we'll set its haveData property to false and the tempalte will render it as a gray ghost tile--avoiding the JavaScript errors that would surely result if the tile were attempted to be rendered. Our validation code is in a new function, validateTile(tile).
// Validate a tile. If not valid, tile.haveData is set to false so it will not attempt to be rendered.

self.validateTile = function (tile) {
    if (tile.hasOwnProperty('value')) {    // if no value property is present in the tile object, invalidate the tile
        tile.haveData = true;
    }
    else {
        tile.haveData = false;  // tile is missing a value property, so invalidate it.
    }

    if (!tile.hasOwnProperty('type')) {
        tile.haveData = false;  // tile is missing a type property, so invalidate it.
    }
    else {
        console.log('validateTile 01 tile:' + tile.id + ', type:' + tile.type);
        switch (tile.type) {
            case 'bar':
            case 'column':
            case 'counter':
            case 'donut':
            case 'kpi':
            case 'pie':
            case 'table':
                break;
            default:
                console.log('validateTile 02 invalidating tile');
                tile.haveData = false;  // tile type is unrecognized, so invalidate it.
                break;
        } // end switch
    } // end else

    if (!tile.haveData) {
        tile.classes = tile.sizeClass + ' tile-gray';
    }
}
validateTile controller method

MVC Controller Changes to Query for Tile Data

We're now in a position to modify the MVC DashboardController. It still has just one action method, Index, which returns a collection of tiles. We're now going to modify the controller to find the query for each tile and fetch the data.

We've made a number of changes to the controller since Part 3:

  • Added code to Index() to fetch data for each tile, first by looking up the DashboardQuery record associated with the tile's query name (in its dataSource property).
  • A new method LoadTileData does the actual work of performing a query and then setting tile.value in the format the tile needs.
  • Updated the Tile class to have an indexer. This lets us get or set a tile property using the syntaxt tile["propertyName"].

Let's take a look at some of the new code. In Index(), lines 92-106 ensure the data for each tile is loaded, unless the tile's dataSource is 'inline'. The method LoadTileData (lines 119-306) does the work of looking up the tile's dataSource query from the DashboardQuery table, executing the query, and setting tile properties such as value from the results.
using System;
using System.Collections.Generic;
using System.Configuration;
using System.Data;
using System.Data.SqlClient;
using System.Linq;
using System.Web;
using System.Web.Mvc;

namespace Dashboard.controllers
{
    public class DashboardController : Controller
    {
        // /Dashboard .... return dashboard layout as JSON

        public JsonResult Index()
        {
            int dashboardId = -1;

            Dashboard dashboard = new Dashboard()
            {
                DashboardName = "Home",
                Username = "default",   // TODO: check for username, if not found fall back to default
                Tiles = new List<Tile>()
            };

            try
            {
                using (SqlConnection conn = new SqlConnection(System.Configuration.ConfigurationManager.AppSettings["Database"]))
                {
                    conn.Open();

                    // Load the default home dashboard.

                    String query = "SELECT DashboardId FROM DashboardLayout WHERE DashboardName='Home' AND Username='default'";

                    using (SqlCommand cmd = new SqlCommand(query, conn))
                    {
                        cmd.CommandType = System.Data.CommandType.Text;
                        using (SqlDataReader reader = cmd.ExecuteReader())
                        {
                            if (reader.Read())
                            {
                                dashboardId = Convert.ToInt32(reader["DashboardId"]);
                            }
                        }
                    }

                    if (dashboardId != -1) // If found a dashboard...
                    {
                        // Load dashboard layout

                        query = @"SELECT prop.* FROM DashboardLayoutTile tile
                                  INNER JOIN DashboardLayoutTileProperty prop  
                                  ON tile.DashboardId=prop.DashboardId AND prop.Sequence=tile.Sequence
                                  WHERE tile.DashboardId=@DashboardId
                                  ORDER BY prop.Sequence,prop.PropertyName";

                        Tile tile = null;
                        int lastSeq = 0;
                        int seq = 0;
                        using (SqlCommand cmd = new SqlCommand(query, conn))
                        {
                            cmd.CommandType = System.Data.CommandType.Text;
                            cmd.Parameters.AddWithValue("@DashboardId", dashboardId);
                            using (SqlDataReader reader = cmd.ExecuteReader())
                            {
                                while (reader.Read())
                                {
                                    seq = Convert.ToInt32(reader["Sequence"]);
                                    if (seq != lastSeq) // starting a new sequence (tile)
                                    {
                                        lastSeq = seq;
                                        if (tile != null)
                                        {
                                            dashboard.Tiles.Add(tile);
                                        }
                                        tile = new Tile()
                                        {
                                            Sequence = seq,
                                            Properties = new List<TileProperty>()
                                        };
                                    }

                                    tile.Properties.Add(new TileProperty(Convert.ToString(reader["PropertyName"]), Convert.ToString(reader["PropertyValue"])));
                                } // end while have tile property
                                dashboard.Tiles.Add(tile); // add final tile to tiles collection
                            }
                        }
                    }

                    // Get the data for each tile. If dataQuery is 'inline', tile already has data.

                    if (dashboard != null && dashboard.Tiles != null)
                    {
                        foreach (Tile tile in dashboard.Tiles)
                        {
                            if (tile.Properties != null)
                            {
                                if (tile["dataSource"] != "inline")
                                {
                                    LoadTileData(conn, tile, tile["dataSource"]);
                                }
                            }
                        }
                    }

                    conn.Close();
                }
            }
            catch (Exception ex)
            {
                Console.WriteLine("EXCEPTION: " + ex.Message);
            }

            return Json(dashboard, JsonRequestBehavior.AllowGet);
        }

        // Lookup and execute the query for a tile, and set its value.

        private void LoadTileData(SqlConnection conn, Tile tile, String queryName)
        {
            String dataQuery = null;
            String valueType = null;
            String query = "SELECT Query,ValueType FROM DashboardQuery WHERE Name=@Name";

            using (SqlCommand cmd = new SqlCommand(query, conn))
            {
                cmd.Parameters.AddWithValue("@Name", queryName);
                using (SqlDataReader reader = cmd.ExecuteReader())
                {
                    if (reader.Read())
                    {
                        dataQuery = Convert.ToString(reader["Query"]);
                        valueType = Convert.ToString(reader["ValueType"]);
                    }
                }
            }

            // If a data query was found, execute it.

            if (dataQuery != null)
            {
                try
                {
                    using (SqlCommand cmd = new SqlCommand(dataQuery, conn))
                    {
                        using (SqlDataReader reader = cmd.ExecuteReader())
                        {
                            switch(valueType)
                            {
                                // number: expect query to return just one numeric value, set into tile.value.
                                case "number":
                                    if (reader.Read())
                                    {
                                        tile["value"] = Convert.ToString(reader[0]);
                                    }
                                    break;
                                // number-array: expect query to return one bar name and one bar value per row.
                                //               sets tile.value to [ value-1, ... valueN ] array of numbers. sets tile.column to array of column names.
                                case "number-array":
                                    {
                                        String columnValue = "[";
                                        String value = "["; // [ (open outer array)
                                        int rows = 0;
                                        List<String> columns = new List<String>();
                                        List<String> types = new List<String>();
                                        // Read through the query results, and build up columns property and value proprty for bar/column tile.
                                        // Expected: two columns per row: <column-name> <value>
                                        while (reader.Read())
                                        {
                                            if (rows>0)
                                            {
                                                value = value + ",";
                                                columnValue = columnValue + ",";
                                            }
                                            columnValue = columnValue + "'" + Convert.ToString(reader[0]) + "'";    // Get the bar column
                                            value = value + Convert.ToString(reader[1]);                            // Get the bar value
                                            rows++;
                                        } // end while reader.Read()
                                        value = value + "]";
                                        columnValue = columnValue + "]";
                                        tile["columns"] = columnValue;
                                        tile["value"] = value;
                                    }
                                    break;
                                // kpi-set: query should return <numeric-value>, <label>, <low-label>, <1/3-label>, <2/3-label>, <high-label>
                                //          tile properties set: value, label, columns (4 values).
                                case "kpi-set":
                                    {
                                        String value = "";
                                        String labelValue = "";
                                        String columnValue = "[";
                                        if (reader.Read())
                                        {
                                            value = Convert.ToString(reader[0]);
                                            labelValue = Convert.ToString(reader[1]);
                                            columnValue = "[" + "'" + Convert.ToString(reader[2]) + "',";
                                            columnValue = columnValue + "'" + Convert.ToString(reader[3]) + "',";
                                            columnValue = columnValue + "'" + Convert.ToString(reader[4]) + "',";
                                            columnValue = columnValue + "'" + Convert.ToString(reader[5]) + "']";
                                            tile["value"] = value;
                                            tile["label"] = labelValue;
                                            tile["columns"] = columnValue;
                                        } // end while reader.Read()
                                    }
                                    break;
                                // table: query should returns rows of column values, which will coped into tile.value as [ [row-1-array], ... [row-N-array] ]
                                //        column names and types will be detected from the query results and set into tile.columns as [ [ col-1-name, col-1-type ], ... [col-N-name, col-N-type] ]
                                case "table":
                                    {
                                        String value = "["; // [ (open outer array)
                                        int rows = 0;
                                        List<String> columns = new List<String>();
                                        List<String> types = new List<String>();
                                        while (reader.Read())
                                        {
                                            if (rows==0)
                                            {
                                                // Load columns
                                                String columnValue = "[";
                                                for (int c = 0; c < reader.FieldCount; c++)
                                                {
                                                    columns.Add(reader.GetName(c));
                                                    types.Add(reader.GetDataTypeName(c));
                                                    if (c>0)
                                                    {
                                                        columnValue = columnValue + ",";
                                                    }
                                                    String type = "string";
                                                    switch(reader.GetDataTypeName(c))
                                                    {
                                                        case "int":
                                                        case "decimal":
                                                        case "float":
                                                            type = "number";
                                                            break;
                                                        case "bit":
                                                        case "boolean":
                                                            type = "boolean";
                                                            break;
                                                        case "date":
                                                        case "datetime":
                                                            type = "string";
                                                            break;
                                                        default:
                                                            type = "string";
                                                            break;
                                                    }
                                                    columnValue = columnValue + "['" + reader.GetName(c) + "','" + type + "']";
                                                }
                                                columnValue = columnValue + "]";
                                                tile["columns"] = columnValue;
                                            }
                                            else
                                            {
                                                value = value + ",";
                                            }
                                            value = value + "[";    // start inner array
                                            int colindex = 0;
                                            foreach (String column in columns)
                                            {
                                                if (colindex!=0)
                                                {
                                                    value = value + ",";
                                                }
                                                if (reader[column] == DBNull.Value)
                                                {
                                                    value = value + "null";
                                                }
                                                else
                                                {
                                                    switch (types[colindex])
                                                    {
                                                        case "date":
                                                            value = value + "'" + Convert.ToDateTime(reader[column]).ToString("MM-dd-yyyy") + "'";
                                                            break;
                                                        default:
                                                            value = value + "'" + Convert.ToString(reader[column]) + "'";
                                                            break;
                                                    }
                                                }
                                                colindex++;
                                            }
                                            value = value + "]";    // end inner array
                                            rows++;
                                        } // end while reader.Read()
                                        value = value + "]";    // end outer array
                                        tile["value"] = value;
                                    }
                                    break;
                                default:
                                    // set tile to have no data
                                    break;
                            }
                        }
                    }
                }
                catch (SqlException ex)
                {
                    String msg = ex.Message;
                    Console.WriteLine(msg);
                }
            }

        }

        private String TileProperty(Tile tile, String propName)
        {
            String value = null;
            if (tile != null && tile.Properties != null)
            {
                foreach (TileProperty prop in tile.Properties)
                {
                    if (prop.PropertyName == propName)
                    {
                        value = prop.PropertyValue;
                        break;
                    }
                }
            }
            return value;
        }
    }

    #region Dashboard Layout Objects

    public class Dashboard
    {
        public String DashboardName { get; set; }
        public String Username { get; set; }
        public List<Tile> Tiles { get; set; }

        public Dashboard()
        {
            DashboardName = "Home";
            Tiles = new List<Tile>();
        }

        public Dashboard(String name)
        {
            DashboardName = name;
            Tiles = new List<Tile>();
        }
    }

    public class Tile
    {
        public int Sequence { get; set; }
        //public String Username { get; set; }
        public List<TileProperty> Properties { get; set; }

        public String this[String index]
        {
            get
            {
                if (this.Properties != null)
                {
                    foreach(TileProperty prop in this.Properties)
                    {
                        if (prop.PropertyName == index)
                        {
                            return prop.PropertyValue;
                        }
                    }
                }
                return null;
            }
            set
            {
                if (this.Properties== null)
                {
                    this.Properties = new List<TileProperty>();
                }
                foreach (TileProperty prop in this.Properties)
                {
                    if (prop.PropertyName == index)
                    {
                        prop.PropertyValue = value;
                        return;
                    }
                }
                this.Properties.Add(new TileProperty(index, value));
            }
        }
    }

    public class TileProperty
    {
        public String PropertyName { get; set; }
        public String PropertyValue { get; set; }

        public TileProperty() { }

        public TileProperty(String name, String value = null) 
        {
            PropertyName = name;
            PropertyValue = value;
        }
    }

    #endregion
}

In  LoadTileData (lines 119-306), the processing of query results and setting of tile values is fairly involved. A switch case statement runs separate logic for each query ValueType, as follows:

  • number : the query is expected to return a single numeric value, which is set into tile.value.
  • number-array : the query is expected to return one bar name and one bar value per row. This ends up in the tile as a tile.columns array of column names, and a tile.value array of numbers.
  • kpi-set : the query is expected to return one numeric value, one label for the value, and four labels for the KPI range. These are set into tile.value, tile.label, and tile.columns.
  • table : the query is expected to return multiple rows, each of which contains multiple column values. Tile.value is set to an array of row items, where each row item is an array of column values. Tile.columns is set to tn array of column names and types, taken from the query results.

Seeing the Dashboard Run with Application Data

We're finally ready to see our dashboard run without hard-coded data. Making sure index.html is set to use the SqlServerDataProvider, we run the project and our dashboard appears. We can see that the tile definitions are coming from the database DashboardLayout tables. We can also see that the data is coming from the database, using the queries in the DashboardQuery table. This is a big milestone for us! While there's plenty more we can and will do to refine and improve our Angular dashboard, we can now view actual application data with it.

Dashboard rendered with Application Data

Where will we go from here? It seems some UI for configuration tiles can now be implemented, allowing users to add / configure / remove tile to personalize their dashboard.

Summary

Today we did all of the following:
  • Refactoring and Tile Improvements
    • Fixed drag-and-drop to work better by refining the drag and drop event handler code.
    • Improved tile rendering by adding a colgroup element to the template's HTML table.
    • Added a format property to tiles, and implemented value formatting for GoogleChartProvider bar and column charts.
    • Added a link property to tiles, and implemented tile click-through.
  • New Chart Tiles
    • Added two new chart tiles (bar chart and pie chart), each a variation on the existing column chart and pie chart tiles. We implemented these tiles in both of our chart services.
  • Back End
    • Added sample application data to the database so we would have data sources to query.
    • Added tile validation to the Angular controller
    • Added MVC controller code to run queries to get tile values when the data service requests the tile layout.
We're making good progress, but how are we feeling about Angular?
  • I like it. Much of Angular is useful and well thought-out, and is becoming intuitive.
  • I am having to clear cache on web pages A LOT when trying out changes. I guess that's a trade-off so that Angular performs well.
  • I still run into gotchas. In today's work, after setting up the back-end to really query application data for tiles, I found the table tile wasn't rendering 3 of its rows. There was an Angular complaint about duplicate ng-repeat indexes (3 of them) in the web console. I got around this by adding 'track by $index' to the end of the ng-repeat condition for table cells.
Download Source
https://drive.google.com/open?id=0B4734rvcufGGWTRqX1B4cjVEWkk

Sunday, October 8, 2017

An AngularJS Dashboard, Part 3: KPI Tile, Responsive Layout, and Back End

NOTE: for best results, view the http: version of this page (else you won't get syntax highlighting).

This is Part 3 in a series on creating a dashboard in AngularJS. I'm blogging as I progressively create the dashboard, refining my Angular experience along the way.

Previously in Part 2, we developed our first four tiles. We implemented the chart tiles using a service, and demonstrated that we could switch out the service to use different chart providers.

Here in Part 3, we are going to add a new tile for KPIs; start work on a responsive tile rendering algorithm; and create a back-end data service for our dashboard. Our objectives are:

  • Add a new tile type, a KPI tile for visualizing a Key Performance Indicator
  • Render tiles more intelligently, taking available screen size into account
  • Begin a back-end service for the dashboard that loads tile layout from a database
Here's what we'll be ending up with today:

KPI Tile

Our first work item for today will be adding a new tile type. A Key Performance Indicator (KPI) is a measurable value that serves as a key metric in evaluting the state of an organization or its activities (such as revenue, expenses, projects, employee performance, customer satisfaction, productivity, fundraising, etc.).

Visually, our KPI tile will show a bar segmented into three equal sections, colored red, yellow and green. The KPI will plot a value on this bar. The KPI will be a horizontal bar, except in the case of the 1x2 size tile which will be vertical.

Here's what a tile definition for a KPI tile looks like.
{
    title: 'Monthly Revenue',
    type: 'kpi',
    width: 1, height: 1,
    color: 'purple',
    dataSource: 'inline',
    columns: ['$0', '$10K', '$20K', '$30K'],
    label: '$15,000',
    value: 60
},
Key properties in the tile definition are these:
  • type: 'kpi'
  • label: a display version of the value. For example, $15,000 or "60 / 100".
  • value: the value to plot on the bar, as a percentage (0 to 100).
  • columns: an array of four label strings. columns[0] will appear at the start of the red area; [1] at the start of the yellow area; [2] at the start of the green area; and [3] at the end of the green area.

Template Changes

Recall that in our template, inside the ng-repeat loop, is markup code for each tile type, made conditional through the use of ng-if. We'll be adding markup for a kpi tile. There are several variations of this markup based on tile dimensions, so the ng-if checks not only for a tile type of 'kpi' but also specific tile dimensions.
<!-- KPI tile -->
<div ng-if="tile.type=='kpi' && tile.height==1"
        style="text-align: left; position: relative; left: 0; right: 0; margin: 0 auto; overflow-x: hidden; overflow-y: hidden;  height: 200px; padding: 16px">
    <div style="display: block; margin-top: 35px; font-size: 10px;">
        <div style="display: inline-block; width: 33%; height: 100%; border: none; padding: 0; margin: 0">{{tile.columns[0]}}</div><div style="display: inline-block; width: 33%; height: 100%; border: none; padding: 0; margin: 0">{{tile.columns[1]}}</div><div style="display: inline-block; text-align: left; width: auto; height: 100%; border: none; padding: 0; margin: 0">{{tile.columns[2]}}</div><div style="display inline; text-align: right; float: right; height: 100%; border: none; padding: 0; margin: 0">{{tile.columns[3]}}</div>
    </div>
    <div style="display: inline-block; width: 100%; height: 15%;  background-color: rgb(45,151,34); border: 1px solid white">
        <div style="background-color: rgb(210,54,34); display: inline-block; width: 33%; height: 100%; border: none; padding: 0; margin: 0"></div><div style="background-color: rgb(252,209,22); display: inline-block; width: 33%; height: 100%; border: none; padding: 0; margin: 0"></div>
    </div>
    <div style="font-size: 24px; text-align: center">{{tile.label}}</div>
    <div style="position: absolute; top: 75px; left: 17px; right: 17px; bottom: 0"><div style="background-color: black; height: 5%; width: {{tile.value}}%; float: left"></div></div>
</div>
<div ng-if="tile.type=='kpi' && tile.height==2 && tile.width==2"
        style="text-align: left; position: relative; left: 0; right: 0; margin: 0 auto; overflow-x: hidden; overflow-y: hidden;  height: 200px; padding: 16px">
    <div style="display: block; margin-top: 135px; font-size: 10px;">
        <div style="display: inline-block; width: 33%; height: 100%; border: none; padding: 0; margin: 0">{{tile.columns[0]}}</div><div style="display: inline-block; width: 33%; height: 100%; border: none; padding: 0; margin: 0">{{tile.columns[1]}}</div><div style="display: inline-block; text-align: left; width: auto; height: 100%; border: none; padding: 0; margin: 0">{{tile.columns[2]}}</div><div style="display inline; text-align: right; float: right; height: 100%; border: none; padding: 0; margin: 0">{{tile.columns[3]}}</div>
    </div>
    <div style="display: inline-block; width: 100%; height: 15%;  background-color: rgb(45,151,34); border: 1px solid white">
        <div style="background-color: rgb(210,54,34); display: inline-block; width: 33%; height: 100%; border: none; padding: 0; margin: 0"></div><div style="background-color: rgb(252,209,22); display: inline-block; width: 33%; height: 100%; border: none; padding: 0; margin: 0"></div>
    </div>
    <div style="font-size: 24px; text-align: center">{{tile.label}}</div>
    <div style="position: absolute; top: 177px; left: 17px; right: 17px; bottom: 0"><div style="background-color: black; height: 10%; width: {{tile.value}}%; float: left"></div></div>
</div>
<!-- KPI 1x2 (vertical) -->
<div ng-if="tile.type=='kpi' && tile.height==2 && tile.width==1"
        style="text-align: left; position: relative; left: 0; right: 0; margin: 0 auto; overflow-x: hidden; overflow-y: hidden;  height: 416px; padding: 16px">
    <div style="display: block; margin-left: 40px; width: 50%; height: 80%; background-color: rgb(210,54,34); border: 1px solid white">
        <div style="background-color: rgb(45,151,34); display: block; width: 100%; height: 33%; border: none; padding: 0; margin: 0"></div><div style="background-color: rgb(252,209,22); display: block; width: 100%; height: 33%; border: none; padding: 0; margin: 0"></div>
    </div><div style="font-size: 24px; text-align: center">{{tile.label}}</div>
    <div style="position: absolute; margin-top: 17px; margin-bottom: 98px; top:0; left: 90px; right: 17px;  height:333px; width: 20px"><div style="position: absolute; bottom: 0; height: {{tile.value}}%; background-color: black; width: 20px"></div></div>
    <div style="position: absolute; margin-top: 17px; top: 0; left: 10px; font-size: 12px">{{tile.columns[3]}}</div>
    <div style="position: absolute; margin-top: 17px; top: 100px; left: 10px; font-size: 12px">{{tile.columns[2]}}</div>
    <div style="position: absolute; margin-top: 17px; top: 215px; left: 10px; font-size: 12px">{{tile.columns[1]}}</div>
    <div style="position: absolute; margin-top: 17px; top: 318px; left: 10px; font-size: 12px">{{tile.columns[0]}}</div>
</div>

Seeing the KPI Tile in Action

When we run the dashboard, here's what the new KPI tile looks like.

1x1 KPI Tile

Our tile is showing the KPI with the tile properties we defined, in a clear visual presentation. Below are a few other examples of the KPI tile in other sizes.

2x1 KPI Tile

The 1x2 KPI shows a vertical bar rather than a horizontal bar.

1x2 KPI Tile

Now that we've added a new tile type, we're going to update our tile definitions. Below is our new list of tile definitions and how it displays.
self.tiles = [
            {
                title: 'Site Traffic',
                type: 'counter',
                width: 1, height: 1,
                color: 'red',
                dataSource: 'inline',
                value: '1365',
                label: 'Site Visits'
            },
            {
                title: 'Orders',
                type: 'counter',
                width: 1, height: 1,
                color: 'yellow',
                dataSource: 'inline',
                value: '100',
                label: 'Orders'

            },
            {
                title: 'Customer Satisfaction',
                type: 'kpi',
                width: 2, height: 1,
                color: 'gray',
                dataSource: 'inline',
                columns: ['Poor', 'Adequate', '', 'Excellent'],
                label: '90 / 100',
                value: 90
            },
            {
                title: 'Monthly Revenue',
                type: 'kpi',
                width: 2, height: 1,
                color: 'gray',
                dataSource: 'inline',
                columns: ['$0', '$10K', '$20K', '$30K'],
                label: '$15,000',
                value: 50
            },
            {
                title: 'Time Management',
                type: 'donut',
                width: 2, height: 1,
                color: 'green',
                dataSource: 'inline',
                columns: ['Work', 'Eat', 'Commute', 'Watch TV', 'Sleep', "Exercise"],
                value: [11, 2, 2, 2, 7, 4]
            },
            {
                title: 'Employees',
                type: 'table',
                width: 1, height: 2,
                color: 'orange',
                dataSource: 'inline',
                columns: [['Name', 'string'], ['Salary', 'number'], ['FTE', 'boolean']],
                value: [
                            ['Mike', 10000, true],
                            ['Jim', 8000, false],
                            ['Alice', 12500, true],
                            ['Bob', 7000, true],
                            ['Cheryl', 7000, true],
                            ['Don', 7000, true],
                            ['Edith', 7000, true],
                            ['Frank', 7000, true],
                            ['Gary', 7000, true],
                            ['Hazel', 7000, true],
                            ['Ira', 7000, true],
                            ['Jacob', 7000, true],
                            ['Loretta', 7000, true],
                            ['Mary', 7000, true],
                            ['Neil', 7000, true],
                            ['Obadiah', 7000, true],
                            ['Peter', 7000, true],
                            ['Quincy', 7000, true]
                ]
            },
            {
                title: 'Charity Fundraising',
                type: 'kpi',
                width: 1, height: 2,
                color: 'purple',
                dataSource: 'inline',
                columns: ['$0', '$5K', '$10K', '$15K'],
                label: '$7,500',
                value: 50
            },
            {
                title: 'Precious Metals',
                type: 'column',
                width: 2, height: 2,
                color: 'blue',
                dataSource: 'inline',
                columns: ['Copper', 'Silver', 'Gold', 'Platinum'],
                value: [8.94, 10.49, 19.30, 21.45]
            }
        ];
Revised Tile Definitions Including KPI Tiles

Here's what our revised layout now looks like when run:

Revised Dashboard with KPI Tiles

Making Our Tile Layout Responsive

Previously, our algorithm for displaying tiles was pretty simple. Each tile was 200 pixels wide plus a 16px right margin, and if we kept displaying them one after the other, they'd eventually wrap to the next line--but would still look nice and aligned. Except that wasn't the whole story. We are supporting tiles that can be 1- or 2-unit wide and 1- or 2-unit high. That can leave odd gaps in the display, depending on the variation and order of tiles combined with the size of a user's screen area. 

To improve on this, we're going to move away from the original method of rendering and instead use an HTML table (HTML tables are much-maligned these days by designers, but they still have their place and this is a good use of a table). We'll be able to take advantage of the colspan and rowspan attributes in our table for positioning our extra-wide and extra-high tiles. 

Our goal for today is to do the following:
  • Be aware of windows resizing, and dynamically compute the number of tile units across we can fit.
  • Render our tiles in an HTML table
This will be an improvement, but it doesn't yet get us "smart fill", where tiles are moved to plug any space gaps. We will address that in a future post.

Adding a New Directive, window-size

You may recall that in Part 2 we had a need to execute some JavaScript after the HTML template was rendered by Angular in order to draw our charts. We added an Angular directive named "after-render". We have a similar need now to compute the number of tiles we can fit across whenever our window is resized, and then to re-render the HTML template. To do this, we will add a new directive named window-size. And, we'll be removing the after-render directive because it is now superfluous now that we have window-resize.

Below is our app.module.js, with after-render removed and window-size added. Window-size records the change in screen height and width, and computes tile-units-across, both initially and whenever the browser window is resized. It also calls a new function in the dashboard controller named computeLayout. We'll study this and other controller changes in just a minute.
var dashboardApp = null;

(function () {
    'use strict';

    // Define the 'dashboardApp' module
    dashboardApp = angular.module('dashboardApp', [
      'dashboard'
    ]);

    angular.module('dashboardApp').directive('windowSize', function ($window) {
        return function (scope, element) {
            var w = angular.element($window);
            scope.getWindowDimensions = function () {
                var tilesAcross = 1;
                var width = w.width()-100;
                if (width > 0) {
                    tilesAcross = Math.floor(width / 216);
                }
                return {
                    'h': w.height(),
                    'w': w.width(),
                    'tilesAcross': tilesAcross,
                    'tablecolumns': tilesAcross,
                    'tablerows': 3
                };
            };
            scope.$watch(scope.getWindowDimensions, function (newValue, oldValue) {
                scope.windowHeight = newValue.h;
                scope.windowWidth = newValue.w;
                scope.tilesAcross = newValue.tilesAcross;
                scope.tablecolumns = newValue.tilesAcross;
                scope.tablerows = 3;
                scope.style = function () {
                    return {
                        'height': (newValue.h - 100) + 'px',
                        'width': (newValue.w - 100) + 'px',
                        'tilesAcross': newValue.tilesAcross,
                        'tablecolumns': tilesAcross,
                        'tablerows': 3
                    };
                };
                var ctrl = angular.element('#dashboard').scope().$$childHead.$ctrl;
                ctrl.computeLayout();
                deferCreateCharts();
            }, true);

            w.bind('resize', function () {
                scope.$apply();
            });
        }
    })

    // Define the dashboard module
    angular.module('dashboard', [
      'dashboard'
    ]);

})();
app.module.js with after-render directive removed and window-size added


Controller Changes

Our controller, dashboard.component.js, needs a number of changes to support our smarter layout. Up until now, our template has used ng-repeat to loop through the controller's Tiles array. Now that we've added smarter layout, we need a version of the tile layout that has been generated for the user's current screen dimensions. We're going to make these changes to our controller:
  • Add a new property named layoutView. We will be changing the template and other code to use layoutView as the reference for tile layout instead of controller.tiles. Controller.tiles remains the master layout, but we'll derive an updated layoutView each time there has been a change in window size.
  • Add a new function named computeLayout. This function is called by window-size each time the window size has changed. it will re-compute the layoutView, and Angular will re-render the HTML template with the revised layout.
Here are the additions to the controller:
// Register 'dashboard' component, along with its associated controller and template

angular.module('dashboard').component('dashboard', {
    templateUrl: '/components/dashboard/dashboard.template.html',
    controller: [
        '$scope', '$window', '$http', 'ChartService', function DashboardController($scope, $window, $http, ChartService) {
            var self = this;
            var ctrl = angular.element('#dashboard').scope().$$childHead.$ctrl;

            self.chartProvider = ChartService.chartProvider();

            self.tablecolumns = function () {
                return $scope.tablecolumns;
            }

            self.tablerows = function () {
                return $scope.tablerows;
            }

            self.title = 'Sample Dashboard';
            self.tiles = [
                {
                    title: 'Site Traffic',
                    type: 'counter',
                    width: 1, height: 1,
                    color: 'red',
                    value: '1365',
                    label: 'Site Visits'
                },
                ...
            ];

            self.layoutView = [];           // set by self.computeLayout

            ...

            // Compute layout based on current screen dimensions (self.tablecolumns()) and generate updated tile layout
            // Inputs: self.tablecolumns() ........... number of tiles across.
            // Ouptuts: self.layoutView .............. updated array of tile rows, each element an array of tiles for a row [[ tile1, ... tileN ], ... [ tileX, ... tileZ ] ]

            self.computeLayout = function () {
                var numcols = self.tablecolumns();
                if (numcols < 1) numcols = 1;
                var newlayout = [];

                var index = 0;
                var row = [];

                var tileid = 1;

                var tile = null;
                for (var t = 0; t < self.tiles.length; t++) {
                    tile = self.tiles[t];
                    if (index + tile.width > numcols) { // no more room in row. commit row and start new one.
                        newlayout.push(row);
                        row = [];
                        index = 0;
                    }
                    tile.id = tileid.toString();
                    tileid = tileid + 1;
                    row.push(tile);
                    index = index + tile.width;
                }
                if (row.length > 0) {   // commit final row if not empty.
                    newlayout.push(row);
                }

                $scope.tablerows = newlayout.length;

                self.layoutView = newlayout;
            };

        }]
});
Additions to dashboard.component.js controller

Let's talk about computeLayout(). It iterates through the master tile layout, self.tiles, constructing an array of row items, where each row item is an array of tiles. If a tile won't fit in the current row, the row is added to the array and a new row is started. Thus, we end up with a layout that will fit on the user's current screen width. When complete, this array of arrays becomes the new value for self.layoutView and the template is re-rendered. On a 1920-pixel wide browser window, layoutView has this value:
[
    [ // row 1
        {
            title: 'Site Traffic',
            type: 'counter',
            width: 1, height: 1,
            color: 'red',
            value: '1365',
            label: 'Site Visits'
        },
        {
            title: 'Orders',
            type: 'counter',
            width: 1, height: 1,
            color: 'yellow',
            value: '100',
            label: 'Orders'

        },
        {
            title: 'Customer Satisfaction',
            type: 'kpi',
            width: 2, height: 1,
            color: 'gray',
            dataSource: 'inline',
            columns: ['Poor', 'Adequate', '', 'Excellent'],
            label: '90 / 100',
            value: 90
        },
        {
            title: 'Monthly Revenue',
            type: 'kpi',
            width: 2, height: 1,
            color: 'gray',
            dataSource: 'inline',
            columns: ['$0', '$10K', '$20K', '$30K'],
            label: '$15,000',
            value: 50
        }
    ],
    [ // row 2
        {
            title: 'Time Management',
            type: 'donut',
            width: 2, height: 1,
            color: 'purple',
            columns: ['Work', 'Eat', 'Commute', 'Watch TV', 'Sleep', "Exercise"],
            value: [11, 2, 2, 2, 7, 4]
        },
        {
            title: 'Employees',
            type: 'table',
            width: 1, height: 2,
            color: 'orange',
            columns: [['Name', 'string'], ['Salary', 'number'], ['FTE', 'boolean']],
            value: [
                        ['Mike', 10000, true],
                        ['Jim', 8000, false],
                        ['Alice', 12500, true],
                        ['Bob', 7000, true],
                        ['Cheryl', 7000, true],
                        ['Don', 7000, true],
                        ['Edith', 7000, true],
                        ['Frank', 7000, true],
                        ['Gary', 7000, true],
                        ['Hazel', 7000, true],
                        ['Ira', 7000, true],
                        ['Jacob', 7000, true],
                        ['Loretta', 7000, true],
                        ['Mary', 7000, true],
                        ['Neil', 7000, true],
                        ['Obadiah', 7000, true],
                        ['Peter', 7000, true],
                        ['Quincy', 7000, true]
            ]
        },
        {
            title: 'Charity Fundraising',
            type: 'kpi',
            width: 1, height: 2,
            color: 'purple',
            dataSource: 'inline',
            columns: ['$0', '$5K', '$10K', '$15K'],
            label: '$7,500',
            value: 50
        },
        {
            title: 'Precious Metals',
            width: 2, height: 2,
            color: 'blue',
            type: 'column',
            columns: ['Copper', 'Silver', 'Gold', 'Platinum'],
            value: [8.94, 10.49, 19.30, 21.45]
        }
    ]
]
layoutView array

Template Changes

Our template needs a number of changes:
  • Reference the new window-size directive (line 1), and remove after-render
  • Replacement of prior outer markup and ng-angular with new markup to generate a table (lines 6-8). 
  • Use of ng-repeat in tr and td elements that reference controller's layoutView, which replaces the previous div with ng-repeat that looped through controller's tiles array
The  inner markup that renders each tile (lines 9-72) doesn't need any changes, except that we're referencing tile.id instead of $index to get tile ids.
<div class="dashboard-controller" window-size>
    <div>
        <div>{{$ctrl.title}} (chart provider: {{$ctrl.chartProvider}})</div>
        <span after-render="deferCreateCharts"></span>
        <div class="dashboard-panel">
            <table>
                <tr ng-repeat="row in $ctrl.layoutView track by $index">
                    <td ng-repeat="tile in row" colspan="{{tile.width}}">
                        <div id="tile-{{tile.id}}"
                             class="tile" ng-class="tile.classes"
                             style="overflow: hidden"
                             draggable="true" ondragstart="tile_dragstart(event);"
                             ondrop="tile_drop(event);" ondragover="tile_dragover(event);">
                            <div class="hovermenu"><i class="fa fa-ellipsis-h" aria-hidden="true"></i></div>
                            <div style="overflow: hidden; white-space: nowrap">{{tile.title}}</div>
                            <div style="position: relative; height: 100%">
                                <!-- COUNTER tile -->
                                <div ng-if="tile.type=='counter' && tile.height==1"
                                     style="text-align: center; position: absolute; left: 0; right: 0; margin: 0 auto; top: 25px">
                                    <div style="font-size: 72px">{{tile.value}}</div>
                                    <div style="font-size: 24px">{{tile.label}}</div>
                                </div>
                                <div ng-if="tile.type=='counter' && tile.height==2"
                                     style="text-align: center; position: absolute; left: 0; right: 0; margin: 0 auto; top: 135px">
                                    <div style="font-size: 72px">{{tile.value}}</div>
                                    <div style="font-size: 24px">{{tile.label}}</div>
                                </div>
                                <!-- KPI tile -->
                                <div ng-if="tile.type=='kpi' && tile.height==1"
                                     style="text-align: left; position: relative; left: 0; right: 0; margin: 0 auto; overflow-x: hidden; overflow-y: hidden;  height: 200px; padding: 16px">
                                    <div style="display: block; margin-top: 35px; font-size: 10px;">
                                        <div style="display: inline-block; width: 33%; height: 100%; border: none; padding: 0; margin: 0">{{tile.columns[0]}}</div><div style="display: inline-block; width: 33%; height: 100%; border: none; padding: 0; margin: 0">{{tile.columns[1]}}</div><div style="display: inline-block; text-align: left; width: auto; height: 100%; border: none; padding: 0; margin: 0">{{tile.columns[2]}}</div><div style="display inline; text-align: right; float: right; height: 100%; border: none; padding: 0; margin: 0">{{tile.columns[3]}}</div>
                                    </div>
                                    <div style="display: inline-block; width: 100%; height: 15%;  background-color: rgb(45,151,34); border: 1px solid white">
                                        <div style="background-color: rgb(210,54,34); display: inline-block; width: 33%; height: 100%; border: none; padding: 0; margin: 0"></div><div style="background-color: rgb(252,209,22); display: inline-block; width: 33%; height: 100%; border: none; padding: 0; margin: 0"></div>
                                    </div>
                                    <div style="font-size: 24px; text-align: center">{{tile.label}}</div>
                                    <div style="position: absolute; top: 75px; left: 17px; right: 17px; bottom: 0"><div style="background-color: black; height: 5%; width: {{tile.value}}%; float: left"></div></div>
                                </div>
                                <div ng-if="tile.type=='kpi' && tile.height==2 && tile.width==2"
                                     style="text-align: left; position: relative; left: 0; right: 0; margin: 0 auto; overflow-x: hidden; overflow-y: hidden;  height: 200px; padding: 16px">
                                    <div style="display: block; margin-top: 135px; font-size: 10px;">
                                        <div style="display: inline-block; width: 33%; height: 100%; border: none; padding: 0; margin: 0">{{tile.columns[0]}}</div><div style="display: inline-block; width: 33%; height: 100%; border: none; padding: 0; margin: 0">{{tile.columns[1]}}</div><div style="display: inline-block; text-align: left; width: auto; height: 100%; border: none; padding: 0; margin: 0">{{tile.columns[2]}}</div><div style="display inline; text-align: right; float: right; height: 100%; border: none; padding: 0; margin: 0">{{tile.columns[3]}}</div>
                                    </div>
                                    <div style="display: inline-block; width: 100%; height: 15%;  background-color: rgb(45,151,34); border: 1px solid white">
                                        <div style="background-color: rgb(210,54,34); display: inline-block; width: 33%; height: 100%; border: none; padding: 0; margin: 0"></div><div style="background-color: rgb(252,209,22); display: inline-block; width: 33%; height: 100%; border: none; padding: 0; margin: 0"></div>
                                    </div>
                                    <div style="font-size: 24px; text-align: center">{{tile.label}}</div>
                                    <div style="position: absolute; top: 177px; left: 17px; right: 17px; bottom: 0"><div style="background-color: black; height: 10%; width: {{tile.value}}%; float: left"></div></div>
                                </div>
                                <!-- KPI 1x2 (vertical) -->
                                <div ng-if="tile.type=='kpi' && tile.height==2 && tile.width==1"
                                     style="text-align: left; position: relative; left: 0; right: 0; margin: 0 auto; overflow-x: hidden; overflow-y: hidden;  height: 416px; padding: 16px">
                                    <div style="display: block; margin-left: 40px; width: 50%; height: 80%; background-color: rgb(210,54,34); border: 1px solid white">
                                        <div style="background-color: rgb(45,151,34); display: block; width: 100%; height: 33%; border: none; padding: 0; margin: 0"></div><div style="background-color: rgb(252,209,22); display: block; width: 100%; height: 33%; border: none; padding: 0; margin: 0"></div>
                                    </div><div style="font-size: 24px; text-align: center">{{tile.label}}</div>
                                    <div style="position: absolute; margin-top: 17px; margin-bottom: 98px; top:0; left: 90px; right: 17px;  height:333px; width: 20px"><div style="position: absolute; bottom: 0; height: {{tile.value}}%; background-color: black; width: 20px"></div></div>
                                    <div style="position: absolute; margin-top: 17px; top: 0; left: 10px; font-size: 12px">{{tile.columns[3]}}</div>
                                    <div style="position: absolute; margin-top: 17px; top: 100px; left: 10px; font-size: 12px">{{tile.columns[2]}}</div>
                                    <div style="position: absolute; margin-top: 17px; top: 215px; left: 10px; font-size: 12px">{{tile.columns[1]}}</div>
                                    <div style="position: absolute; margin-top: 17px; top: 318px; left: 10px; font-size: 12px">{{tile.columns[0]}}</div>
                                </div>
                                <div ng-if="tile.type=='table'"
                                     style="text-align: left !important; padding: 16px; height: 100%">
                                    <div style="height: 100%; text-align: left !important">
                                        <table style="padding-bottom: 52px;">
                                            <tr>
                                                <th ng-repeat="col in tile.columns">{{col[0]}}</th>
                                            </tr>
                                            <tr ng-repeat="row in tile.value">
                                                <td ng-repeat="cell in row">
                                                    <div ng-if="tile.columns[$index][1]=='number'" class="td-right">{{cell}}</div>
                                                    <div ng-if="tile.columns[$index][1]!='number'">{{cell}}</div>
                                                </td>
                                            </tr>
                                        </table>
                                    </div>
                                </div>
                                <!-- TABLE tile -->
                                <div ng-if="tile.type=='table'"
                                     style="text-align: left !important; padding: 16px; height: 100%">
                                    <div style="height: 100%; text-align: left !important">
                                        <table style="padding-bottom: 52px;">
                                            <tr>
                                                <th ng-repeat="col in tile.columns">{{col[0]}}</th>
                                            </tr>
                                            <tr ng-repeat="row in tile.value">
                                                <td ng-repeat="cell in row">
                                                    <div ng-if="tile.columns[$index][1]=='number'" class="td-right">{{cell}}</div>
                                                    <div ng-if="tile.columns[$index][1]!='number'">{{cell}}</div>
                                                </td>
                                            </tr>
                                        </table>
                                    </div>
                                </div>
                                <!-- Google DONUT tile -->
                                <div ng-if="$ctrl.chartProvider=='Google' && tile.type=='donut'"
                                     style="text-align: center; padding: 16px; height: 100%">
                                    <div class="donutchart" id="tile-donutchart-{{tile.id}}" style="height: 100%"></div>
                                </div>
                                <!-- Google COLUMN tile -->
                                <div ng-if="$ctrl.chartProvider=='Google' && tile.type=='column'"
                                     style="text-align: center; padding: 16px; height: 100%">
                                    <div class="columnchart" id="tile-columnchart-{{tile.id}}" style="height: 100%"></div>
                                </div>
                                <!-- Chart.js DONUT tile -->
                                <div ng-if="$ctrl.chartProvider=='ChartJS' && tile.type=='donut'"
                                     style="text-align: center; padding: 16px; height: 100%">
                                    <canvas class="chartjs-donutchart" id="tile-canvas-{{tile.id}}" style="margin: 0 auto; width: 90%; max-width: 90%; height: auto; max-height: 80%"></canvas>
                                </div>
                                <!-- Chart.js COLUMN tile -->
                                <div ng-if="$ctrl.chartProvider=='ChartJS' && tile.type=='column'"
                                     style="text-align: center; padding: 16px; height: 100%">
                                    <canvas class="chartjs-columnchart" id="tile-canvas-{{tile.id}}" style="margin: 0 auto; width: 90%; max-width: 90%; height: auto; max-height: 80%" ng-if="tile.width==1 && tile.height==1"></canvas>
                                    <canvas class="chartjs-columnchart" id="tile-canvas-{{tile.id1}}" style="margin: 0 auto; width: 90%; max-width: 90%; height: auto; max-height: 75%" ng-if="tile.width==2 && tile.height==1"></canvas>
                                    <canvas class="chartjs-columnchart" id="tile-canvas-{{tile.id}}" style="margin: 0 auto; width: 90%; max-width: 90%; height: auto; max-height: 85%" ng-if="tile.height==2"></canvas>
                                </div>
                                <!-- PLACEHOLDER tile -->
                                <div ng-if="tile.type=='placeholder'"
                                     style="position: absolute; top: 0">
                                </div>
                            </div>
                        </div> <!-- end tile -->
                    </td>
                </tr>
            </table>
        </div>
    </div>

    <script lang="javascript">
        // Handler for start of tile drag.
        function tile_dragstart(ev) {
            ev.dataTransfer.dropEffect = "move";
            var sourceId = getParentTileId(ev.target);
            if (sourceId != null) {
                ev.dataTransfer.setData("text/plain", sourceId);
            }
        }

        // Handler for tile dragover.
        function tile_dragover(ev) {
            ev.preventDefault();
            ev.dataTransfer.dropEffect = "move";
        }

        var controller = null;

        // Handler for tile drop.
        function tile_drop(ev, tiles) {
            ev.preventDefault();
            var destId = getParentTileId(ev.target);
            var sourceTileIndex = parseInt(ev.dataTransfer.getData("text").substring(5)) - 1;
            var destTileIndex = parseInt(destId.substring(5)) - 1;
            var ctrl = angular.element('#dashboard').scope().$$childHead.$ctrl;
            controller = ctrl;
            ctrl.dragTile(sourceTileIndex, destTileIndex);
        }

        // Given a drag element (which may or may not have an Id, and which may or may not be in a tile), return the tile Id that contains it. Or null, if not in a tile.
        function getParentTileId(element) {
            var ctrl = angular.element('#dashboard').scope().$$childHead.$ctrl;
            for (var t = 1; t <= ctrl.tiles.length; t++) {
                if (document.getElementById('tile-' + t.toString()).contains(element)) {
                    return 'tile-' + t.toString();
                } // end if
            } // next t
            return null;
        }
    </script>
</div>

Seeing The New Layout in Action

Now we're ready to try things out. For starters, we'll run the project in a full-screen browser window on my 1920-wide Dell laptop.

The tiles are rendering now in a table, and the dashboard has concluded it can fit 6 tile units across.

Dashboard on 1920-wide laptop

Now, we'll reduce our window size, to two-thirds of the width. The dashboard re-renders, with a revised layout to fit the new screen width. Now, there is only room for four tiles across.


Let's reduce it even more, to the width of a smartphone.


This last example shows why we will need to go further and do "smart fill." At a future time, we'll be adding the smarts to move tiles higher up in the layout to fill gaps. Today, though, this is as far as we'l go on revising the layout and rendering.

Creating a Back End

Up until now, we've been cheating a bit. Our tile definitions and their data are just inline in the dashboard controller. This isn't very "real world". In the real world, the layout for a dashboard would vary from one customer to another. We'd want users to be able to modify their layout and have it remembered. And, we'd expect the data for these tiles to come from a real data source, such as an application database.

To create a back end, we'll be adding another service, the DataService. We saw in Part 2 that injecting a chart service was a very useful pattern, because it allowed us to have multiple implementations of the service. We are going to do exactly the same thing with the DataService, with two implementations in mind:

  • The first will be a "demo" data service, with the same inline tile definitions and data that have been in our poject all along, but now separated into a service. 
  • The second version of the data service will access ASP.NET MVC controller actions, which in turn will draw data from a SQL Server database.

Controller Updates for New Data Service

First off, we want to tell Angular the our dashboard controller now requires a data service.
angular.module('dashboard').component('dashboard', {
    templateUrl: '/components/dashboard/dashboard.template.html',
    controller: [
        '$scope', '$window', '$http', 'ChartService', 'DataService', function DashboardController($scope, $window, $http, ChartService, DataService) {
            var self = this;
            var ctrl = angular.element('#dashboard').scope().$$childHead.$ctrl;

            self.chartProvider = ChartService.chartProvider();
            self.dataProvider = DataService.dataProvider();
Injecting Data Service in dashboard.component.js

Here's a diagram illustrating the actors in our project now--highlighting the newly-added data service.


Data Service injected into Controller

As with the chart controller, the first function we'll add to the data service is a simple one returning the name of the data provider in case we want to display it.

Previousy, the tile definitions were inline in the dashoard controller. We're replacing that code with a call to the data service to get the tile layout:
            self.title = 'Sample Dashboard';
            self.tiles = DataService.getTileLayout();
            self.layoutView = [];           // set by self.computeLayout
Retrieving tile layout from data service

Demo DataService

Now we'll create the demo data service. We're adding a new code module in our project's dashboard folder named demo.data.service.js. In it we have two functions:
  • dataProvider : this function returns the name of the data service ("demo")
  • getTileLayout : this function returns the tiles array that the controller needs.
'use strict';
'use strict';

// DemoDataService : DataService, contains functions for access tile layouts and data for tiles (demo version, all data is inline).
//
// dataProvider ............. returns the name of the data provider ("demo")
// getTileLayout ............ returns the master tile layout for the dashboard

dashboardApp.service('DataService', function ($http) {

    this.dataProvider = function () {
        return 'Demo';
    }

    // -------------------- getTileLayout : Returns the master layout for tiles (returns tiles array) ------------------

    this.getTileLayout = function (dashboardName) {
        var tiles = [
                    {
                        title: 'Site Traffic',
                        type: 'counter',
                        width: 1, height: 1,
                        color: 'red',
                        dataSource: 'inline',
                        value: '1365',
                        label: 'Site Visits'
                    },
                    {
                        title: 'Orders',
                        type: 'counter',
                        width: 1, height: 1,
                        color: 'yellow',
                        dataSource: 'inline',
                        value: '100',
                        label: 'Orders'

                    },
                    {
                        title: 'Customer Satisfaction',
                        type: 'kpi',
                        width: 2, height: 1,
                        color: 'gray',
                        dataSource: 'inline',
                        columns: ['Poor', 'Adequate', '', 'Excellent'],
                        label: '90 / 100',
                        value: 90
                    },
                    {
                        title: 'Monthly Revenue',
                        type: 'kpi',
                        width: 2, height: 1,
                        color: 'gray',
                        dataSource: 'inline',
                        columns: ['$0', '$10K', '$20K', '$30K'],
                        label: '$15,000',
                        value: 50
                    },
                    {
                        title: 'Time Management',
                        type: 'donut',
                        width: 2, height: 1,
                        color: 'green',
                        dataSource: 'inline',
                        columns: ['Work', 'Eat', 'Commute', 'Watch TV', 'Sleep', "Exercise"],
                        value: [11, 2, 2, 2, 7, 4]
                    },
                    {
                        title: 'Employees',
                        type: 'table',
                        width: 1, height: 2,
                        color: 'orange',
                        dataSource: 'inline',
                        columns: [['Name', 'string'], ['Salary', 'number'], ['FTE', 'boolean']],
                        value: [
                                  ['Mike', 10000, true],
                                  ['Jim', 8000, false],
                                  ['Alice', 12500, true],
                                  ['Bob', 7000, true],
                                  ['Cheryl', 7000, true],
                                  ['Don', 7000, true],
                                  ['Edith', 7000, true],
                                  ['Frank', 7000, true],
                                  ['Gary', 7000, true],
                                  ['Hazel', 7000, true],
                                  ['Ira', 7000, true],
                                  ['Jacob', 7000, true],
                                  ['Loretta', 7000, true],
                                  ['Mary', 7000, true],
                                  ['Neil', 7000, true],
                                  ['Obadiah', 7000, true],
                                  ['Peter', 7000, true],
                                  ['Quincy', 7000, true]
                        ]
                    },
                    {
                        title: 'Charity Fundraising',
                        type: 'kpi',
                        width: 1, height: 2,
                        color: 'purple',
                        dataSource: 'inline',
                        columns: ['$0', '$5K', '$10K', '$15K'],
                        label: '$7,500',
                        value: 50
                    },
                    {
                        title: 'Precious Metals',
                        type: 'column',
                        width: 2, height: 2,
                        color: 'blue',
                        dataSource: 'inline',
                        columns: ['Copper', 'Silver', 'Gold', 'Platinum'],
                        value: [8.94, 10.49, 19.30, 21.45]
                    }
                ];
        return tiles;
    }

});
demo.data.service.js

getTileLayout() returns the same tiles array we've always had, but with one difference. We've added a dataSource property to each tile. For the demo data service, this is just set to 'inline', signifying that the tile already have their data. Later on when we create the alternate edition of the data service that talks to a database, the dataSource property will identify the name of the query that will be used to pull tile data.

In index.html, our web page, we now must include our data service.
        <!-- Google Visualization chart service -->
        <script src="/components/dashboard/google.chart.service.js"></script>
        <script type="text/javascript" src="https://www.gstatic.com/charts/loader.js"></script>

        <!-- Chart.js chart service -->
        <!--<script src="/components/dashboard/chartjs.chart.service.js"></script>
        <script src="/Scripts/Chart.bundle.js" type="text/javascript"></script>-->

        <!-- Demo data service -->
        <script src="/components/dashboard/demo.data.service.js"></script>

        <script src="/components/dashboard/dashboard.component.js"></script>

    </body>
</html>

Trying Out the Demo Data Service

Now we can try things out. We clear our cache and launch the project, and soon we see a familiar sight:
Dashboard now using demo data service

Our dashboard doesn't look any different, but we've made some important internal changes. The tile layout and tile data now comes from a data service.

A Real Back-End

The data service we just created, DemoDataService, still has tile definitions and tile data inline in the JavaScript. Now that we have the shape of the service defined, it's time to create a real data service that talks to a web server back end and retrieves data from a database.

We need to give our app a database, so we'll create one. If you download the sample project, you'll find that it's configured to use the demo data service (demo.data.service.js) and no database is required. However, the readme file explains how to run a script (dashboard_database.sql) to create a SQL Server database and how to change the project to use the SQL Server data service (sql.data.service.js).

Creating the Dashboard Database

Our database is mimicking an application database. We will ultimately depend on our database for (1) dashboard configuration (definitions of tiles and dashboard layout,) and (2) application data to query to set values for each tile. Today, we are going to tackle the first category, dashboard configuration. We will address the second category, querying application data, in our next post. This means we'll be hitting the database to find out which tiles to show, but we'll still have hard-coded data values for right now.

To track database configuration, we'll create these tables:

  • A DashboardLayout table to represent the current dashboard tile layout. This will include not only a default layout, but saved layouts for individual users. If an entry can't be found for the user's username, we'll select the record named 'default'.
  • A DashboardLayoutTile table to link the DashboardLayout record to individual tiles and an order of layout. If a dashboard had 5 tiles, it would have 5 DashboardLayoutTile records.
  • A DashboardLayoutTileProperty table to hold each property name and value for a tile.
The relationship between these tables is as follows.
  • The back end will locate a user's dashboard record in the DashboardLayout table (if a customized record is not found for a user, then 'default' is used to get the default layout).
  • The sequence of tiles is found by reading records from the subordinate DashboardLayoutTile table. This gives us the order of tiles.
  • The tile detail (properties) are loaded from DashboardLayoutTileProperty for each tile.

Relataionship of Dashboard Configuration Tables

Here's how our tables look loaded with some configuration data. We've defined five tiles in our default dashboard (one of each type).

Sample Dashboard Configuration Data

With all of this in place, we can now implement our SQL Server data service.

SQL Server Data Service

As with the Demo Data Service, the SQL Server Data Service has the same functions (dataProvider and getTileLayout). To get the tile layout, the service needs to talk to the back end MVC action /Dashboard/Index which will query the dashboard database tables and return a Json tiles array.
'use strict';

// SqlDataService : DataService, contains functions for access tile layouts and data for tiles (SQL Server version, all data comes from database).
//
// dataProvider ............. returns the name of the data provider ("demo")
// getTileLayout ............ returns the master tile layout for the dashboard

var dbg = null;

dashboardApp.service('DataService', function ($http) {

    this.dataProvider = function () {
        return 'SQL Server';
    }

    // -------------------- getDashboard :  getTileLayout : Returns the master layout for tiles (returns tiles array) ------------------

    this.getTileLayout = function () {   // TODO: add dashboard-name as param

        var request = $http({
            method: "GET",
            url: "/Dashboard/",
        });

        return (request.then(handleSuccess, handleError));
    }

    function handleSuccess(response) {

        var tile = null;
        var tiles = [];

        var name = '';
        var value = '';

        // create tile object with properties

        for (var t = 0; t < response.data.Tiles.length; t++) {
            tile = {};
            for (var p = 0; p < response.data.Tiles[t].Properties.length; p++) {
                name = response.data.Tiles[t].Properties[p].PropertyName;
                value = response.data.Tiles[t].Properties[p].PropertyValue;
                switch (name) {
                    case 'columns': // column values beginning with [ are evaluated into arrays.
                        tile[name] = eval(value);
                        break
                    case 'width':       // treat these property value as integers
                    case 'height':
                        tile[name] = parseInt(value);
                        break;
                    case 'value':
                        if (value.substring(0, 1) == '[') {
                            tile[name] = eval(value);
                        }
                        else {
                            tile[name] = value;
                        }
                        break;
                    default:    // treat all other property values as strings
                        tile[name] = value;
                        break;
                }
            }
            tiles.push(tile);   // add tile to tiles array
        }

        return tiles;
    }

    function handleError(response) {
        console.log('sql.data.service.js : handleError 01');
        alert('error');
    }

});

sql.server.data.service

Note that we do some post-processing after getting the Json tiles array back from the MVC action. If you recall out previous inline tiles structure, proeprties like columns and value sometimes contain arrays. Since we're just storing the value property for a tile in the database as a string, values like '[ 1, 2, 3, 4, 5 ]' need to converted from a string to a JavaScript array. We do this with the JavaScript eval function (lines 45 and 53).


Revised Dashboard Controller

Although we've taken pains to implement identical functions in our second data service, it does have some behavioral differences that are going to force us to revise our Angular dashboard controller code. The DataService's getTileLayout function makes an Ajax call to the back end, and then returns the Json tile layout with a JavaScript promise. This means the controller's self.tiles = DataService.getTileLayout(); statement won't work correctly. Instead, we need to assign the function result in a promise (lines 136-161 below). And, since the rest of the initialization code in the controller isn't ready to execute until we have the tiles array set, we'll move all the rest of that code into the promise as well.
//'use strict'; // removed because of complaints about dragTile function - in strict mode code, functions can only be declared at top level or inside a block
// Register 'dashboard' component, along with its associated controller and template

angular.module('dashboard').component('dashboard', {
    templateUrl: '/components/dashboard/dashboard.template.html',
    //templateUrl: '/Scripts/HRMS/Dash/dashboard/dashboard.template.html',
    controller: [
        '$scope', '$window', '$http', 'ChartService', 'DataService', function DashboardController($scope, $window, $http, ChartService, DataService) {
            var self = this;
            var ctrl = angular.element('#dashboard').scope().$$childHead.$ctrl;

            self.chartProvider = ChartService.chartProvider();
            self.dataProvider = DataService.dataProvider();

            self.tablecolumns = function () {
                return $scope.tablecolumns;
            }

            self.tablerows = function () {
                return $scope.tablerows;
            }

            self.title = 'Sample Dashboard';

            // Complete a drag-and-drop operation.

            self.dragTile = function (sourceTileIndex, destTileIndex) {

                try {
                    var sourceTile = self.tiles[sourceTileIndex];

                    self.tiles.splice(sourceTileIndex, 1); // remove source tile from tile list

                    if (sourceTileIndex < destTileIndex) {
                        destTileIndex--;
                    }

                    self.tiles.splice(destTileIndex, 0, sourceTile); // insert dest tile

                    // Regenerate tile ids.
                    var tile;
                    if (self.tiles != null) {
                        for (var t = 0; t < self.tiles.length; t++) {
                            tile = self.tiles[t];
                            tile.id = 'tile-' + (t + 1).toString(); // tile id (tile_1, tile_2, ...)
                        }
                    }

                    var scope = angular.element('#dashboard').scope();
                    scope.$apply(this);
                } catch (e) {
                    console.log('dragTile: EXCEPTION '); // + e.toString());
                }
            };

            // Draw charts (tile types: donut, column, table) - execute JavaScript to invoke chart service.

            self.createCharts = function () {

                if (self.chartProvider == 'ChartJS') {
                    $('.chartjs-donutchart').each(function () {
                        self.drawDonutChart(this.id);
                    });

                    $('.chartjs-columnchart').each(function () {
                        self.drawColumnChart(this.id);
                    });
                }

                if (self.chartProvider == 'Google') {
                    $('.donutchart').each(function () {
                        self.drawDonutChart(this.id);
                    });

                    $('.columnchart').each(function () {
                        self.drawColumnChart(this.id);
                    });
                }
            }

            // Draw a donut chart

            self.drawDonutChart = function (elementId) {
                ChartService.drawDonutChart(self, elementId);
            }

            // Draw a column chart

            self.drawColumnChart = function (elementId) {
                ChartService.drawColumnChart(self, elementId);
            }

            // Compute layout based on current screen dimensions (self.tablecolumns()) and generate updated tile layout
            // Inputs: self.tablecolumns() ........... number of tiles across.
            // Ouptuts: self.layoutView .............. updated array of tile rows, each element an array of tiles for a row [[ tile1, ... tileN ], ... [ tileX, ... tileZ ] ]

            self.computeLayout = function () {
                if (self.tiles == null) return;

                var numcols = self.tablecolumns();
                if (numcols < 1) numcols = 1;

                var newlayout = [];

                var index = 0;
                var row = [];

                var tileid = 1;

                var tile = null;
                for (var t = 0; t < self.tiles.length; t++) {
                    tile = self.tiles[t];
                    if (index + tile.width > numcols) { // no more room in row. commit row and start new one.
                        newlayout.push(row);
                        row = [];
                        index = 0;
                    }
                    tile.id = tileid.toString();
                    tileid = tileid + 1;
                    row.push(tile);
                    index = index + tile.width;
                }
                if (row.length > 0) {   // commit final row if not empty.
                    newlayout.push(row);
                }

                $scope.tablerows = newlayout.length;

                self.layoutView = newlayout;
            };

            self.layoutView = [];           // set by self.computeLayout

            // Load tile definitions and perform remaining initilization.

            DataService.getTileLayout().then(function (response) {
                self.tiles = response;

                // Generate tile properties id, sizeClass, bgClass, and classes.
                var tile;
                if (self.tiles != null) {
                    for (var t = 0; t < self.tiles.length; t++) {
                        tile = self.tiles[t];
                        tile.id = 'tile-' + (t + 1).toString(); // tile id (tile_1, tile_2, ...)
                        tile.bgClass = "tile-" + tile.color; // tile background color class (tile-red, tile-yellow, ...)
                        tile.sizeClass = "tile_" + tile.width.toString() + "_" + tile.height.toString(); // tile size class (tile_1_1, tile_1_2, tile_2_1, tile_2_2)
                        tile.classes = tile.sizeClass + ' ' + tile.bgClass; // full list of classes to customize tile appearance
                        if (tile.color == 'white' || tile.color == 'yellow' || tile.color == 'gray') {
                            tile.textColor = 'black';
                        }
                        else {
                            tile.textColor = 'white';
                        }
                    }
                }

                self.computeLayout();
                deferCreateCharts();
            });
        }]
});

Revised Dashboard Controller Code with Promise for getTileLayout

MVC Controller

To retreive our dashboard layout from the database, we need a back-end service. We've added an MVC controller to the ASP.NET project named DashboardController. It's Index() function reads dashboard layout from the database and returns it as a Json result. Our JavaScript SQL Server Data Service calls this MVC action in its getTileLayout() function.
using System;
using System.Collections.Generic;
using System.Configuration;
using System.Data.SqlClient;
using System.Linq;
using System.Web;
using System.Web.Mvc;

namespace Dashboard.controllers
{
    public class DashboardController : Controller
    {
        // /Dashboard .... return dashboard layout as JSON

        public JsonResult Index()
        {
            int dashboardId = -1;

            Dashboard dashboard = new Dashboard()
            {
                DashboardName = "Home",
                Username = "default",   // TODO: check for username, if not found fall back to default
                Tiles = new List<Tile>()
            };
            
            try
            {
                using (SqlConnection conn = new SqlConnection(System.Configuration.ConfigurationManager.AppSettings["Database"]))
                {
                    conn.Open();

                    // Load the default home dashboard.

                    String query = "SELECT DashboardId FROM DashboardLayout WHERE DashboardName='Home' AND Username='default'";

                    using (SqlCommand cmd = new SqlCommand(query, conn))
                    {
                        cmd.CommandType = System.Data.CommandType.Text;
                        using (SqlDataReader reader = cmd.ExecuteReader())
                        {
                            if (reader.Read())
                            {
                                dashboardId = Convert.ToInt32(reader["DashboardId"]);
                            }
                        }
                    }

                    if (dashboardId != -1) // If found a dashboard...
                    {
                        // Load dashboard layout

                        query = @"SELECT prop.* FROM DashboardLayoutTile tile
                                  INNER JOIN DashboardLayoutTileProperty prop  
                                  ON tile.DashboardId=prop.DashboardId
                                  WHERE tile.DashboardId=@DashboardId
                                  ORDER BY prop.Sequence,prop.PropertyName";

                        Tile tile = null;
                        int lastSeq = 0;
                        int seq = 0;
                        using (SqlCommand cmd = new SqlCommand(query, conn))
                        {
                            cmd.CommandType = System.Data.CommandType.Text;
                            cmd.Parameters.AddWithValue("@DashboardId", dashboardId);
                            using (SqlDataReader reader = cmd.ExecuteReader())
                            {
                                while(reader.Read())
                                {
                                    seq = Convert.ToInt32(reader["Sequence"]);
                                    if (seq != lastSeq) // starting a new sequence (tile)
                                    {
                                        lastSeq = seq;
                                        if (tile != null)
                                        {
                                            dashboard.Tiles.Add(tile);
                                        }
                                        tile = new Tile()
                                        {
                                            Sequence = seq,
                                            Properties = new List<TileProperty>()
                                        };
                                    }

                                    tile.Properties.Add(new TileProperty(Convert.ToString(reader["PropertyName"]), Convert.ToString(reader["PropertyValue"])));
                                } // end while have tile property
                                dashboard.Tiles.Add(tile); // add final tile to tiles collection
                            }
                        }
                    }

                    conn.Close();
                }
            }
            catch(Exception ex)
            {
                Console.WriteLine("EXCEPTION: " + ex.Message);
            }

            return Json(dashboard, JsonRequestBehavior.AllowGet);
        }
    }

    #region Dashboard Layout Objects

    public class Dashboard
    {
        public String DashboardName { get; set; }
        public String Username { get; set; }
        public List<Tile> Tiles { get; set; }

        public Dashboard()
        {
            DashboardName = "Home";
            Tiles = new List<Tile>();
        }

        public Dashboard(String name)
        {
            DashboardName = name;
            Tiles = new List<Tile>();
        }
    }

    public class Tile
    {
        public int Sequence { get; set; }
        public List<TileProperty> Properties { get; set; }
    }

    public class TileProperty
    {
        public String PropertyName { get; set; }
        public String PropertyValue { get; set; }

        public TileProperty() { }

        public TileProperty(String name, String value = null) 
        {
            PropertyName = name;
            PropertyValue = value;
        }
    }

    #endregion
}
DashboardController

Index.html Changes

We need to modify our web page, index.html, to load the SQL Server Data Service instead of the Demo Data Service.
        ...
        <!-- Demo data service -->
        <!--<script src="/components/dashboard/demo.data.service.js"></script>-->

        <!-- SQL Server data service -->
        <script src="/components/dashboard/sql.data.service.js"></script>

        <script src="/components/dashboard/dashboard.component.js"></script>
    </body>
</html>
Index.html changes to allow Switching between Data Services

Seeing the Dashboard Run with DB Back-end for Configuration

Now we're ready to run our project with the dashboard configuration coming from our database. When we run it, we get the following dashboard rendered. Previously, changing our dashboard meant changing out our tile structure in JavaScript code. Now, we can make changes to the database to change the dashboard.

Dashboard Rendered from Back-End and DB Dashboard Configuration

Our back end is off to a good start, but it isn't finished yet. Next time, we'll add querying the database to supply tile data.

Summary

Today in Part 3 we accomplished a great deal:

  • We implemented a new tile type, a KPI tile.
  • We changed our too-simple tile rendering scheme to detect window resizing, compute the number of tile units across that will fit, and render tiles in an HTML table.
  • We created the notion of a data service, injected into the dashboard controller.
  • We implemented a simple Demo Data Service, with inline JavaScript tile definitions.
  • We added a database and defined tables for dashboard layout.
  • We implemented a SQL Server Data Service, that retrieves dashboard layout from a back end.
  • We implemented a back-end Dashboard MVC controller which accesses our database. 

Download Source
Dashboard_03.zip
https://drive.google.com/file/d/0B4734rvcufGGaDVFdnpNeW44X1U/view?usp=sharing

Next: An AngularJS Dashboard, Part 4: Bar/Pie Charts and Back-end Data Queries