This is Part 2 in a series on creating a dashboard in AngularJS.
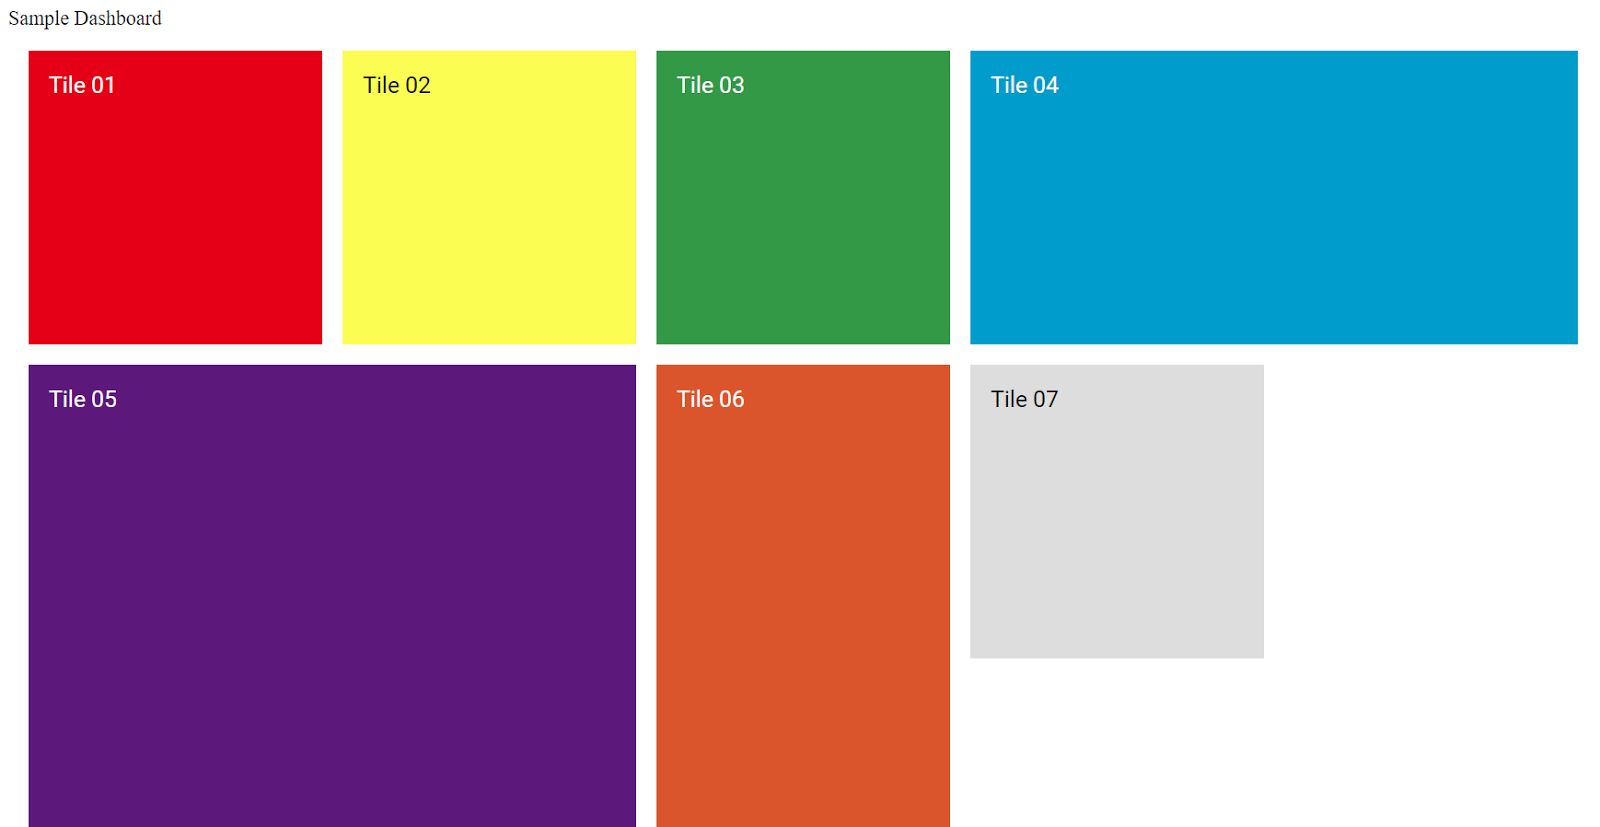
Previously in Part 1, we laid the foundation for a dashboard in Angular. However, all that did was render empty placeholder tiles--colored rectangles, each 1- or 2- units wide and 1- or 2-units tall, with a title. Now, we're going to start creating tiles that do visualizations.
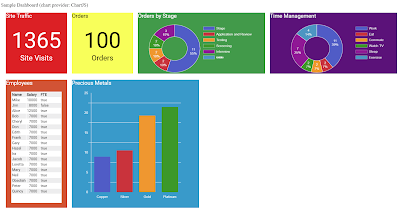
Here in Part 2, we will be creating our first four tiles: a counter tile, a table tile, and two chart tiles (donut chart and colimn chart). Here's a glimpse of what we'll be ending up with:

New Dashboard Tiles
Counter Tile
A counter tile is a simple kind of tile whose purpose is to simply display a number. You might use a counter to display things like Number of Orders, Number of Completed Shipments, Number of Web Visits, or Number of Open Support Tickets. Our tile will devote a large part of its display area to the counter value; and below that, a label giving the number some context.Tile Definition
Now that we are actually starting to implement tiles, we will need to add a few new properties to the tile objects in our controller's tiles array.- type : indicates the type of tile. Our first tile will have type 'counter'
- value : for a counter tile, a numeric value to display (note: some of the other tile types such as chart tiles, will have complex values for this property).
- label : for a counter tile, this is the text that appears below the count.
self.tiles = [
    {
        title: 'Site Traffic',
        type: 'counter',
        width: 1, height: 1,
        color: 'red',
        value: '1365',
        label: 'Site Visits'
    },
    {
        title: 'Orders',
        type: 'counter',
        width: 1, height: 1,
        color: 'yellow',
        value: '100',
        label: 'Orders'

    },
Template Changes
This simple tile type can be rendered with a small bit of HTML. In our template (dashboard.template.html), in the ng-repeat loop that runs for each tile, we will be inserting our new HTML markup for the counter tile. However, other tile types are coming as well, so we only want this new counter tile markup to be emitted when the current tile type is 'counter'.The way we achieve this is with Angular's ng-if directive, which will only include an area of markup if its condition evaluates to true. The condition we'll use here is tile.type=='counter'. In order to position well on 1-high and 2-high tiles, we're going to need two variations of our markup. We add an additional condition to ng-if to also take tile.height into account. Now we have two variations of the counter markup for single-high and double-high tiles (lines 10 and 15).
<div id="tile-{{$index+1}}" ng-repeat="tile in $ctrl.tiles"
        class="tile" ng-class="tile.classes"
        style="overflow: hidden"
        draggable="true" ondragstart="tile_dragstart(event);"
        ondrop="tile_drop(event);" ondragover="tile_dragover(event);">
    <div class="hovermenu"><i class="fa fa-ellipsis-h" aria-hidden="true"></i></div>
    <div style="overflow: hidden; white-space: nowrap">{{tile.title}}</div>
    <div style="position: relative; height: 100%">
        <!-- COUNTER tile -->
        <div ng-if="tile.type=='counter' && tile.height==1"
                style="text-align: center; position: absolute; left: 0; right: 0; margin: 0 auto; top: 25px">
            <div style="font-size: 72px">{{tile.value}}</div>
            <div style="font-size: 24px">{{tile.label}}</div>
        </div>
        <div ng-if="tile.type=='counter' && tile.height==2"
                style="text-align: center; position: absolute; left: 0; right: 0; margin: 0 auto; top: 135px">
            <div style="font-size: 72px">{{tile.value}}</div>
            <div style="font-size: 24px">{{tile.label}}</div>
        </div>
        <!-- PLACEHOLDER tile -->
        <div ng-if="tile.type=='placeholder'"
                style="position: absolute; top: 0">
        </div>
    </div>
</div> <!-- next tile -->
Seeing It Work: Counter Tile
Expanding the tile definition and template is all we need to do, so we're ready to try out the new counter tile. Here's how it renders when we run the project:
Counter Tiles in Dashboard
As you can see, the counter tiles honored the title, color, width, and height properties that we established last time in Part 1; and, they output the new value and label properties as well.
Let's expand these tiles to larger sizes. We'll try a 2 x 1 red tile and a 1 x 2 yellow tile.

2x1 and 1x2 Counter Tiles in Dashboard
The tiles rendered as we expected them to, but this points out a problem with our current approach of just emitting each tile plus a right margin in the page flow... if the tile sizes are mismatched, there may be gaps (empty spaces) in our dashboard. Eventually, we're going to need a smarter filling algorithm to avoid empty spaces. We won't be worrying about that in today's lesson however.
Table Tile
Next, we'll implement another tile for showing tabular data. A table tile displays a data table, with a vertical scroll bar if necessary. You could use a table tile for things like Pending Orders, Sales Executive Performance, or Monthly Product Sales. Our tile will display an HTML table with alternating row colors. If a column has numeric data, we'd like to be right-aligned.
Tile Definition
The table tile has these properties:
- type : 'table'
- value: an array of row items, where each row item is an array of column values. This is a big departure from our prior counter tile, which just had a single number as a value.
- columns: an array of column items, where a column item is an array containing header text and a data type ('string', 'number', 'boolean'). Type 'number' columns will be right-justified.
With the above new properties, here is a sample definition of a table tile:
{
title: 'Employees',
type: 'table',
width: 1, height: 1,
color: 'orange',
columns: [['Name', 'string'], ['Salary', 'number'], ['FTE', 'boolean']],
value: [
            ['Mike', 10000, true],
            ['Jim', 8000, false],
            ['Alice', 12500, true],
            ['Bob', 7000, true],
            ['Cheryl', 7000, true],
            ['Don', 7000, true],
            ['Edith', 7000, true],
            ['Frank', 7000, true],
            ['Gary', 7000, true],
            ['Hazel', 7000, true],
            ['Ira', 7000, true],
            ['Jacob', 7000, true],
            ['Loretta', 7000, true],
            ['Mary', 7000, true],
            ['Neil', 7000, true],
            ['Obadiah', 7000, true],
            ['Peter', 7000, true],
            ['Quincy', 7000, true]
        ]
}
Template Changes
In our template, in the ng-repeat loop that runs for each tile, we will be inserting new HTML markup for the table tile. As with the previous counter tile, we'll use ng-if to include the markup only when the current tile type is 'table'.
<!-- TABLE tile -->
<div ng-if="tile.type=='table'"
        style="text-align: left !important; padding: 16px; height: 100%">
    <div style="height: 100%; text-align: left !important">
        <table style="padding-bottom: 52px;">
            <tr>
                <td ng-repeat="col in tile.columns">{{col[0]}}</td>
            </tr>
            <tr ng-repeat="row in tile.value">
                <td ng-repeat="cell in row">
                    <div ng-if="tile.columns[$index][1]=='number'" class="td-right" >{{cell}}</div>
                    <div ng-if="tile.columns[$index][1]!='number'">{{cell}}</div>
                </td>
            </tr>
        </table>
    </div>
The markup uses multiple ng-repeat directives to iterate through the tile data:- The first ng-repeat (line 7) iterates through the tile.column array of column headings, which are emitted as a
row of header cells.
- The seccond ng-repeat (line 9) iterates through each row item array in the tile.value property., creating a row.
- An inner ng-repeat (line 10) iterates through the row item array, outputing a cell for each value. If the column header for the column is of type 'number', the
cell is right-aligned.
Seeing It Work: Table Tile
We're ready to see our tile in action. Here's how the table tile renders when we run the project:

Adding a Chart Service
Next up, we're going to be getting a bit more ambitious. It's time to tackle chart tiles. These are more complex, and will involve using a Chart API. Our choice of API is the Google Visualization API, which has a lot of capability and is easy to use. You should read the terms of this and any other API you use, but my reading of it is that it is free to use, even for commercial purposes, as long as you honor the terms of service.
With this work it's time to make some structural changes. Up untll now, JavaScript code for our dashboard has resided in the dashboard controller (dashboard.component.js), and our tiles have been simply rendered via markup in our template. Now however we're going to start needing JavaScript functions to do things like render charts. If we add this code to our controller, its going to get long--so we're instead going to put this code into a new service, the ChartService (google.chart.service.js).
The chart service will be injected into our controller by Angular. because we'll be declaring 'ChartService' as a dependency.
The diagram below illustrates how the controller interacts with the injected chart service to render a chart into the DOM with Angular. This approach, another use of dependency injection, will also allow us to be completely modular with our implementation of chart tiles. If we needed to implement a different chart API, only the chart service module would be affected. (We will in fact implement charts with an alternative API later on in this posting, but for now we'll focus on using the Google Visualizaton API.)

Chart Service is injected into Dashboard Controller by Angular
Donut Chart Tile (Google Visualization)
Now we'll create our first chart tile. This will be a donut chart. Compared to the counter tile we first implemented, the donut chart tile will be more challenging:- The value property will need to link to a collection of values rather than a single value.
- Each value will also need a descriptive label
- In addition to markup in the dashboard template HTML, we'll also need some JavaScript code to execute after the markup is rendered. That code will reside in our new chart service (which in turn will use the Google Visualization API.)
Tile Definition
Our new tile type will have these properties:
- type: set to 'donut'
- columns: an array of string labels for each donut slice.
- value: an array of numeric values, one for each slide. The length of the value array should match the length of the column array. Pie slice colors will be assigned automatically.
Here's a sample tile definition:
{
    title: 'Time Management',
    type:  'donut',
    width: 2, height: 1,
    color: 'purple',
    columns: ['Work', 'Eat', 'Commute', 'Watch TV', 'Sleep', "Exercise" ],
    value: [11, 2, 2, 2, 7, 4]
},
Template Changes
As with the former tile type, we'll be using ng-if and checking tile.type to only emit donut chart markup when the chart provider is 'Google' and the chart type is 'donut'. You'll note the markup is very simple, just a div with a class of 'donutchart'. This will be replaced with chart markup later on when we apply some JavaScript so the API can work its wonders. We are assigning the class name "donutchart" to the div so that we can easily locate it later when it is time to invoke the API.
The service contains a chartProvider function which returns the name of the chart provider ("Google"). We can leverage this value in our template to make intelligent decisions about the markup needed.
The service also contains a drawDonutChart function which renders a donut chart in an element. This function takes two parameters: the controller instance that is calling it (this is needed to access tile definitions), and the HTML element where the chart is to be rendered. The code does the following:
We have a new short function in the controller named createCharts. This function is going to be invoked whenever Angular finishes rendering the template.
<!-- Google DONUT tile -->
<div ng-if="$ctrl.chartProvider=='Google' && tile.type=='donut'"
        style="text-align: center; padding: 16px; height: 100%">
    <div class="donutchart" id="tile-donutchart-{{$index+1}}" style="height: 100%"></div>
</div>
Adding a Service and Rendering the Donut Chart
It's time to create our new chart service, in file google.chart.service.js.The service contains a chartProvider function which returns the name of the chart provider ("Google"). We can leverage this value in our template to make intelligent decisions about the markup needed.
The service also contains a drawDonutChart function which renders a donut chart in an element. This function takes two parameters: the controller instance that is calling it (this is needed to access tile definitions), and the HTML element where the chart is to be rendered. The code does the following:
- Finds the controller tile it is supposed to render.
- Converts the tile definition's columns and value property into a Google data table. This will fail if the tile's value property is not in the format expected by the API.
- Creates some option settings for the chart. These need to be adjusted based on our four possible tile sizes.
- Invokes the Google Visualization API to render a pie chart (a donut chart is merely a pie chart with its center missing).
'use strict';

// GoogleChartService : ChartService, contains functions for rendering a variety of dashboard chart tiles (Google Visualization API implementation)
//
// drawDonutChart ............. renders a Google Visualization donut chart
// drawColumnChart ............ renders a Google Visualization column chart
// drawTableChart ............. renders a Google Visualization table chart

dashboardApp.service('ChartService', function ($http) {

    var COLOR_RGB_BLUE = 'RGB(69,97,201)';
    var COLOR_RGB_RED = 'RGB(210,54,54)';
    var COLOR_RGB_ORANGE = 'RGB(247,152,33)'
    var COLOR_RGB_GREEN = 'RGB(45,151,34)';
    var COLOR_RGB_PURPLE = 'RGB(148,36,151)';
    var COLOR_RGB_CYAN = 'RGB(56,151,196)';
    var COLOR_RGB_YELLOW = 'RGB(252,209,22)';

    this.chartProvider = function () {
        return 'Google';
    }

    // -------------------- drawDonutChart : Draw a Google Visualization donut chart ------------------

    this.drawDonutChart = function (self, elementId) {
        var index = getTileIndexFromId(elementId);
        var tile = self.tiles[index];

        // Convert the tile's column and value properties (both 1-dimensional arrays) to the data structure Google expects:
        // [ heading1, heading2 ]
        // [ label1, value1 ]
        // [ labelN, valueN ]

        var newValues = [];
        var dataTable = tile.value;
        if (dataTable != null) {
            for (var i = 0; i < dataTable.length; i++) {
                if (i == 0) {
                    newValues.push([ "Label1", "Label2" ]);
                }
                newValues.push([ tile.columns[i], tile.value[i] ]);
            }
            dataTable = newValues;
        }

        if (dataTable === null) {
            dataTable = [];
        }

        try {
            var data = google.visualization.arrayToDataTable(dataTable);

            var options = {
                pieHole: 0.4,
                backgroundColor: 'transparent',
                enableInteractivity: false  // this is to ensure drag and drop works unimpaired on mobile devices
            };

            if (tile.width == 1 && tile.height==1) { /* if 1xn tile, suppress legend */
                options.legend = 'none';
                options.chartArea = { top: 0, left: '100px', width: '95%', height: '75%' }
            }
            else if (tile.width == 2 && tile.height == 1) { /* if 2x1 tile, legend at right */
                options.legend = {
                    position: 'right',
                    maxLines: 10,
                },
                options.legendPosition = 'right';
                options.legendTextStyle = {
                    color: 'white'
                };
                options.chartArea = { top: 0, left: 0, width: '95%', height: '75%' }
            }
            else if (tile.width == 1 && tile.height == 2) { /* if 1x2 tile, legend at top TODO: why doesn't legend appear? */
                options.legend = {
                    position: 'top',
                    maxLines: 10,
                },
                options.legendPosition = 'top';
                options.legendTextStyle = {
                    color: 'white'
                };
            }
            else { /* 2x2 */
                options.legend = {
                    position: 'top',
                    maxLines: 10,
                },
                options.legendPosition = 'top';
                options.legendTextStyle = {
                    color: 'white'
                };
            }

            var chart = new google.visualization.PieChart(document.getElementById(elementId));
            chart.draw(data, options);
        }
        catch (e) {
            console.log('exception ' + e.toString());
        }
    }

    //------------------ getTileIndexFromId : return the tile index of a tile element Id (tile-1 => 0, tile-2 => 1, etc.) -------------------

    // given a tile rendering area id like tile-donut-1, return index (e.g. 0)

    function getTileIndexFromId(elementId) {
        var pos = -1;
        var text = elementId;
        while ((pos = text.indexOf('-')) != -1) {
            text = text.substring(pos + 1);
        }
        var index = parseInt(text) - 1;
        return index;
    }

});
Calling the Service from the Controller
We've seen the service code, but how does it connect up with the controller? We can answer that by looking at the first few lines of revised code for the controller.angular.module('dashboard').component('dashboard', {
templateUrl: '/components/dashboard/dashboard.template.html',
controller: [
'$scope', '$http', 'ChartService', function DashboardController($scope, $http, ChartService) {
var self = this;
var ctrl = angular.element('#dashboard').scope().$$childHead.$ctrl;
self.title = 'Sample Dashboard';
self.tiles = [
self.chartProvider = ChartService.chartProvider();
Notice that the controller now lists 'ChartService' as a dependency. Angular will ensure this service is passed into the controller as variable ChartService. The controller code is now free to call functions of this service, such as ChartService.drawDonutChart(...).We have a new short function in the controller named createCharts. This function is going to be invoked whenever Angular finishes rendering the template.
// Draw charts (tile types: donut, column, table) - execute JavaScript to invoke chart service.

self.createCharts = function () {

    if (self.chartProvider == 'Google') {
        $('.donutchart').each(function () {
            self.drawDonutChart(this.id);
        });
    }
}

// Draw a donut chart

self.drawDonutChart = function (elementId) {
    ChartService.drawDonutChart(self, elementId);
}
This function in turn calls the ChartService's drawDonutChart function, which causes the chart to be created.Invoking JavaScript After the Template Renders: Adding a Directive
We now have a service with a function to render our chart, and we've added a controller function to ensure all charts get created--but we need this code to be called right after Angular renders our dashboard template.How do we achieve this? Unfortunately, there isn't a directive built in to Angular that will help us. So, we'll need to create our own directive. We can do that by adding a little bit of code to our app module, app.module.js.
// Define the 'dashboardApp' module
dashboardApp = angular.module('dashboardApp', [
    'dashboard'
]);

// afterRender directive
// source: http://gsferreira.com/archive/2015/03/angularjs-after-render-directive/

angular.module('dashboardApp')
    .directive('afterRender', ['$timeout', function ($timeout) {
    var def = {
        restrict: 'A',
        terminal: true,
        transclude: false,
        link: function (scope, element, attrs) {
            deferCreateCharts();
        }
    };
    return def;
}]);
This gives us a new directive (after-render) which we can add to our template, dashboard.template.html.<div>
<div>{{$ctrl.title}} (chart provider: {{$ctrl.chartProvider}})</div>
<span after-render="deferCreateCharts"></span>
<div class="dashboard-panel">
<div id="tile-{{$index+1}}" ng-repeat="tile in $ctrl.tiles"
class="tile" ng-class="tile.classes"
style="overflow: hidden"
draggable="true" ondragstart="tile_dragstart(event);"
ondrop="tile_drop(event);" ondragover="tile_dragover(event);">
<div class="hovermenu"><i class="fa fa-ellipsis-h" aria-hidden="true"></i></div>
<div style="overflow: hidden; white-space: nowrap">{{tile.title}}</div>
<div style="position: relative; height: 100%">
<!-- COUNTER tile -->
<div ng-if="tile.type=='counter' && tile.height==1"
style="text-align: center; position: absolute; left: 0; right: 0; margin: 0 auto; top: 25px">
<div style="font-size: 72px">{{tile.value}}</div>
<div style="font-size: 24px">{{tile.label}}</div>
</div>
<div ng-if="tile.type=='counter' && tile.height==2"
style="text-align: center; position: absolute; left: 0; right: 0; margin: 0 auto; top: 135px">
<div style="font-size: 72px">{{tile.value}}</div>
<div style="font-size: 24px">{{tile.label}}</div>
</div>
<!-- TABLE tile -->
<div ng-if="tile.type=='table'"
style="text-align: left !important; padding: 16px; height: 100%">
<div style="height: 100%; text-align: left !important">
<table style="padding-bottom: 52px;">
<tr>
<th ng-repeat="col in tile.columns">{{col[0]}}</th>
</tr>
<tr ng-repeat="row in tile.value">
<td ng-repeat="cell in row">
<div ng-if="tile.columns[$index][1]=='number'" class="td-right" >{{cell}}</div>
<div ng-if="tile.columns[$index][1]!='number'">{{cell}}</div>
</td>
</tr>
</table>
</div>
</div>
<!-- Google DONUT tile -->
<div ng-if="$ctrl.chartProvider=='Google' && tile.type=='donut'"
style="text-align: center; padding: 16px; height: 100%">
<div class="donutchart" id="tile-donutchart-{{$index+1}}" style="height: 100%"></div>
</div>
With this last piece in place, we're now ready to try out our new tile.Seeing it Work: Donut Chart (Google Visualization API)
When we run our project now, we see our donut chart render.

Donut Chart (2x2 tile)
We can see the donut chart is rendering nicely within the tile area, with a legend above that shows the labels for each color. The percentage is shown for each pie slice.
How does this tile look at other sizes? Let's take a look.

Donut Chart (1x1, 2x1)
We can also see that the donut rendering code is considering the tile dimensions and deciding whether there is room for the legend, and where it should go (top or right). In the case of a 1x1 tile, the legend is omitted.
Column Chart Tile (Google Visualization)
We're now going to implement another chart, a column chart (vertical bar chart), again using the Google Visualization API. This will follow the same pattern as the donut chart: namely, a service function to render the chart will invoke the API. The column chart has similar properties to the donut tile:- The value property will need to link to an array of labels and value array items.
- Each value will need a descriptive label
- We'll need to use an API to generate the chart
Tile Definition
Our new tile will have these properties:
- type: set to 'column'
- columns: an array of names for each bar.
- value: an array of numeric values, one for each bar. The value array and the columns array should be the same length. Bar colors will be assigned automatically.
Here's an example tile definition:
{
    title: 'Precious Metals',
    width: 2, height: 2,
    color: 'blue',
    type: 'column',
    columns: [ 'Copper', 'Silver', 'Gold', 'Platinum' ],
    value: [ 8.94, 10.49, 19.30, 21.45 ]
},
Template Changes
As with the donut chart tile, we'll be inserting a small bit of markup, with the ng-if directive checking for a chart provider of 'Google' and a tile type of 'column'. The div where the chart is to be rendered is assigned a class of 'columnchart', which the JavaScript drawing code will search for.
The dashboard is starting to look real, but there's still much to do. Going forward, we need to:
<!-- Google COLUMN tile -->
<div ng-if="$ctrl.chartProvider=='Google' && tile.type=='column'"
        style="text-align: center; padding: 16px; height: 100%">
    <div class="columnchart" id="tile-columnchart-{{$index+1}}" style="height: 100%"></div>
</div>
Service Code
Just as we added a draw function to the chart service earlier, we'll do that again now. The drawColumnChart function will render a column chart by doing the following:
- Finding the tile the element it is passed is part of.
- Converting the tile's value data to a form accepted by the Google Visualization API.
- Creating options for the chart, and fine-tuning them based on tile size.
- Adding code to display labels on each bar.
- Invoking the Google Visualization API to draw a column chart.
// -------------------- drawColumnChart : Draw a Google Visualization column chart ------------------

this.drawColumnChart = function (self, elementId) {
    var index = getTileIndexFromId(elementId);
    var tile = self.tiles[index];

    // Convert the tile's column and value properties (both 1-dimensional arrays) to the data structure Google expects:
    // [ heading1, heading2 ]
    // [ label1, value1 ]
    // [ labelN, valueN ]

    var newValues = [];
    var dataTable = tile.value;
    if (dataTable != null) {
        for (var i = 0; i < dataTable.length; i++) {
            if (i == 0) {
                newValues.push(["Element", "Density" ]);
            }
            newValues.push([ tile.columns[i], tile.value[i] ]);
        }
        dataTable = newValues;
    }

    if (dataTable === null) {
        dataTable = [];
    }

    try {
        // Get tile data and expand to include assigned bar colors.

        var colors = [COLOR_RGB_BLUE, COLOR_RGB_RED, COLOR_RGB_ORANGE, COLOR_RGB_GREEN, COLOR_RGB_PURPLE, COLOR_RGB_CYAN, COLOR_RGB_YELLOW];
        var maxColorIndex = colors.length;
        var colorIndex = 0;

        var tileData = dataTable;
        var newTileData = [];
        if (tileData != null) {
            for (var i = 0; i < tileData.length; i++) {
                if (i == 0) {
                    newTileData.push([ tileData[i][0], tileData[i][1], { role: 'style' } ]);
                }
                else {
                    var color = colors[colorIndex++];
                    if (colorIndex >= maxColorIndex) colorIndex = 0;
                    newTileData.push([tileData[i][0], tileData[i][1], color]);
                }
            }
        }

        var data = google.visualization.arrayToDataTable(newTileData);

        var options = {
            colors: ['red', 'yellow', 'blue'],
            backgroundColor: 'transparent',
            legend: 'none',
            vAxis: {
                minValue: 0,
                gridlines: {
                    color: tile.textColor
                },
                textStyle: {
                    color: tile.textColor
                }
            },
            hAxis: {
                minValue: 0,
                gridlines: {
                    color: tile.textColor
                },
                textStyle: {
                    color: tile.textColor
                }
            },
            enableInteractivity: false  // this is to ensure drag and drop works unimpaired on mobile devices
        };

        options.chartArea = { top: 0, left: 0, width: '100%', height: '70%' }

        if (tile.width == 1) { /* if 1xn tile, suppress legend */
            options.chartArea = { top: 0, left: 0, width: '100%', height: '70%' }
        }
        else if (tile.width == 2 && tile.height == 1) { /* if 2x1 tile, legend at right */
            options.chartArea = { top: 0, left: 0, width: '100%', height: '70%' }
        }
        else if (tile.width == 1 && tile.height == 2) { /* if 1x2 tile, legend at top */
            options.chartArea = { top: 0, left: 0, width: '100%', height: '80%' }
        }
        else { /* if 2x2 tile, legend at top */
            options.chartArea = { top: 0, left: 30, width: '100%', height: '80%' }
        }

        var view = new google.visualization.DataView(data); // Create a custom view so values are displayed near the top of each bar.
        view.setColumns([0, 1,
                            {
                                calc: "stringify",
                                sourceColumn: 1,
                                type: "string",
                                role: "annotation"
                            },
                            2]);

        var chart = new google.visualization.ColumnChart(document.getElementById(elementId));
        chart.draw(view, options);
    }
    catch (e) {
        console.log('exception ' + e.toString());
    }
}
Calling the Service from the Controller
We'll update the controller's createCharts function to ensure that all elements of class columnchart are processed via the Chart Service's drawColumnChart function.
// Draw charts (tile types: donut, column, table) - execute JavaScript to invoke chart service.

self.createCharts = function () {

    console.log('controller: self.createCharts()');

    if (self.chartProvider == 'Google') {
        $('.donutchart').each(function () {
            self.drawDonutChart(this.id);
        });

        $('.columnchart').each(function () {
            self.drawColumnChart(this.id);
        });
    }
}

// Draw a donut chart

self.drawDonutChart = function (elementId) {
    ChartService.drawDonutChart(self, elementId);
}

// Draw a column chart

self.drawColumnChart = function (elementId) {
    ChartService.drawColumnChart(self, elementId);
}
New Includes for our Web Page
In order for everything we've done to work, we need to include a few new things in our web page. We'll need a script tag to include our new chart service, google.chart.service.js. We also need to include a reference to the Google Visualization API. We add the following to the bottom of index.html:
        <script src="Scripts/angular.min.js"></script>
        <script src="app/app.module.js"></script>

        <!-- Google Visualization chart service -->
        <script src="/components/dashboard/google.chart.service.js"></script>
        <script type="text/javascript" src="https://www.gstatic.com/charts/loader.js"></script>

        <script src="/components/dashboard/dashboard.component.js"></script>

    </body>
</html>
Seeing it Work: Column Chart (Google Visualization API)
When we run our project now, we see our column chart render.


ColumnChart (2x2 tile)
We can see the column chart is filling the tile area nicely, with a value displayed near top of each vertical bar and labels below the bars. Each bar is in a different color, following the same palette we assigned to the donut chart.
Alternate Chart Tile Implementation using Chart.js
We've now created two chart tiles that work well using the Google Visualization API, and it will be very straightforward to add additional chart types to the chart service and template following the same pattern. But, what if we'd like to use a different API? When we discussed the Chart Service earlier, one reason we gave for this approach was making it easy to support alternative implementations using other APIs. There are a number of reasons why one API might not be a good fit for someone else; you might have a problem with the terms of service, or have specific requirements such as the ability to run offline.
To illustrate how we can change out the implementation of a service, we are going to reimplement the Chart Service, this time using Chart.js. Chart.js is an open source chart library, and unlike Google Visualization it can be included locally and can render charts even when offline.
In order to switch out one chart service for another, we'll need to do the following:

This is even more difficult t when you are using an API to render your tile. For example, the Google Visualization API is really powerful. But, it has eccentricities and the decisions it makes about where to put things and where to leave extra blank space might not mesh well with your expecations. In the charts covered here in Part 2, I easily spent the majority of my time experiementing with parameters in the Google Visualization API in order to gain more control over the placement and appearance of charts--and was only partially successful. There are still some chart tiles in some sizes that aren't great, but I'm limited in how much control I have over what the API does.
In order to switch out one chart service for another, we'll need to do the following:
- Support identical tile definition structures for the chart tiles.
- Implement a chartjs.chart.service.js chart service that provides the same functions found in google.chart.service.js (chartProvider, drawDonutChart, drawColumnChart). And, we'll need to keep these two implementations in sync as we add new chart functions over time.
- Update the template to output appropriate markup for each chart provider / tile type combination. The markup we already have for Google needs to be accompanied by markup that will work for Chart.js.
- Update index.html to only include the chart service and API we want to use.
Let's get started.
Chart Service
Below is our Chart.js edition of the chart service.
'use strict';

// ChartJSChartService : ChartService, contains functions for rendering a variety of dashboard chart tiles (chart.js implementation)
//
// drawDonutChart ................. renders a Chart.js donut chart
// draweDonutChart ............. renders a Google Visualization donut chart

dashboardApp.service('ChartService', function ($http) {

    var COLOR_RGB_BLUE = 'RGB(69,97,201)';
    var COLOR_RGB_RED = 'RGB(210,54,54)';
    var COLOR_RGB_ORANGE = 'RGB(247,152,33)'
    var COLOR_RGB_GREEN = 'RGB(45,151,34)';
    var COLOR_RGB_PURPLE = 'RGB(148,36,151)';
    var COLOR_RGB_CYAN = 'RGB(56,151,196)';
    var COLOR_RGB_YELLOW = 'RGB(252,209,22)';

    this.chartProvider = function () {
        return 'ChartJS';
    }

    // -------------------- drawDonutChart : Draw a Chart.js donut chart --------------------

    this.drawDonutChart = function (self, elementId) {

        var index = getTileIndexFromId(elementId);
        var tile = self.tiles[index];

        var ctx = document.getElementById(elementId).getContext('2d');

        var options = {
            responsive: true,
            maintainAspectRatio: false,
            legend: {
                display: 'true',
                position: 'top',
                labels: {
                    fontColor: tile.textColor
                }
            },
            title: { display: false },
            animation: {
                //    animateScale: true,
                //    animateRotate: true
                duration: 500,
                easing: "easeOutQuart",
                onComplete: function () {       // Add labels and percent over slices
                    var ctx = this.chart.ctx;
                    ctx.font = Chart.helpers.fontString(Chart.defaults.global.defaultFontFamily, 'normal', Chart.defaults.global.defaultFontFamily);
                    ctx.textAlign = 'center';
                    ctx.textBaseline = 'bottom';

                    this.data.datasets.forEach(function (dataset) {

                        for (var i = 0; i < dataset.data.length; i++) {
                            var model = dataset._meta[Object.keys(dataset._meta)[0]].data[i]._model,
                                total = dataset._meta[Object.keys(dataset._meta)[0]].total,
                                mid_radius = model.innerRadius + (model.outerRadius - model.innerRadius) / 2,
                                start_angle = model.startAngle,
                                end_angle = model.endAngle,
                                mid_angle = start_angle + (end_angle - start_angle) / 2;

                            var x = mid_radius * Math.cos(mid_angle);
                            var y = mid_radius * Math.sin(mid_angle);

                            ctx.fillStyle = tile.textColor;
                            var pct = Math.round(dataset.data[i] / total * 100);
                            var percent = String(pct) + "%";

                            if (pct >= 5) {
                                ctx.fillText(dataset.data[i], model.x + x, model.y + y);
                                // Display percent in another line, line break doesn't work for fillText
                                ctx.fillText(percent, model.x + x, model.y + y + 15);
                            }
                        }
                    });
                }
            }
        };

        if (tile.width == 1 && tile.height == 1) { // 1x1 tile: hide legend
            options.legend = { display: false };
        }
        else if (tile.width == 2 && tile.height == 1) { // 2x1 tile: legend to right of donut chart
            options.legend = {
                display: 'true',
                position: 'right',
                labels: {
                    fontColor: tile.textColor
                }
            };
        }

        var donutChart = new Chart(ctx, {
            type: 'doughnut',
            options: options,
            data: {
                labels: tile.columns,
                datasets: [{
                    data: tile.value,
                    backgroundColor: [COLOR_RGB_BLUE, COLOR_RGB_RED, COLOR_RGB_ORANGE, COLOR_RGB_GREEN, COLOR_RGB_PURPLE, COLOR_RGB_CYAN, COLOR_RGB_YELLOW],
                    borderColor: tile.textColor,
                    borderWidth: 1
                }]
            }
        });
    }

    // -------------------- drawColumnChart : Draw a Chart.js column (vertical bar) chart --------------------

    this.drawColumnChart = function (self, elementId) {

        var index = getTileIndexFromId(elementId);
        var tile = self.tiles[index];

        var ctx = document.getElementById(elementId).getContext('2d');

        var options = {
            defaultFontColor: tile.textColor,
            responsive: true,
            maintainAspectRatio: false,
            legend: {
                display: false,
            },
            title: { display: false },
            scales: {
                xAxes: [{
                    color: tile.textColor,
                    gridLines: {
                        offsetGridLines: true,
                        color: 'transparent', // tile.textColor,
                        zeroLineColor: tile.textColor
                    },
                    ticks: {
                        fontColor: tile.textColor
                    }
                }],
                yAxes: [{
                    display: true,
                    gridLines: {
                        offsetGridLines: true,
                        color: tile.textColor,
                        zeroLineColor: tile.textColor
                    },
                    ticks: {
                        beginAtZero: true,
                        //max: 100,
                        min: 0,
                        color: tile.textColor,
                        fontColor: tile.textColor
                    }
                }]
            }
        };

        var columnChart = new Chart(ctx, {
            type: 'bar',
            options: options,
            data: {
                labels: tile.columns,
                datasets: [{
                    //label: '# of Votes',
                    data: tile.value,
                    backgroundColor: [COLOR_RGB_BLUE, COLOR_RGB_RED, COLOR_RGB_ORANGE, COLOR_RGB_GREEN, COLOR_RGB_PURPLE, COLOR_RGB_CYAN, COLOR_RGB_YELLOW],
                    borderColor: tile.textColor,
                    borderWidth: 0
                }]
            }
        });
    }

    //------------------ getTileIndexFromId : return the tile index of a tile element Id (tile-1 => 0, tile-2 => 1, etc.) -------------------

    // given a tile rendering area id like tile-donut-1, return index (e.g. 0)

    function getTileIndexFromId(elementId) {
        var pos = -1;
        var text = elementId;
        while ((pos = text.indexOf('-')) != -1) {
            text = text.substring(pos + 1);
        }
        var index = parseInt(text) - 1;
        return index;
    }

});
Template Changes
We're adding new markup with ng-if directives to generate HTML for donut charts and column charts when the chart provider is 'ChartJS'. Note that Chart.js uses a canvas element, whereas Google used a div element.<!-- Chart.js DONUT tile -->
<div ng-if="$ctrl.chartProvider=='ChartJS' && tile.type=='donut'"
style="text-align: center; padding: 16px; height: 100%">
<canvas class="chartjs-donutchart" id="tile-canvas-{{$index+1}}" style="margin: 0 auto; width: 90%; max-width: 90%; height: auto; max-height: 80%"></canvas>
</div>
<!-- Chart.js COLUMN tile -->
<div ng-if="$ctrl.chartProvider=='ChartJS' && tile.type=='column'"
style="text-align: center; padding: 16px; height: 100%">
<canvas class="chartjs-columnchart" id="tile-canvas-{{$index+1}}" style="margin: 0 auto; width: 90%; max-width: 90%; height: auto; max-height: 80%" ng-if="tile.width==1 && tile.height==1"></canvas>
<canvas class="chartjs-columnchart" id="tile-canvas-{{$index+1}}" style="margin: 0 auto; width: 90%; max-width: 90%; height: auto; max-height: 75%" ng-if="tile.width==2 && tile.height==1"></canvas>
<canvas class="chartjs-columnchart" id="tile-canvas-{{$index+1}}" style="margin: 0 auto; width: 90%; max-width: 90%; height: auto; max-height: 85%" ng-if=" tile.height==2"></canvas>
</div>
Web Page Changes
Lastly, we need to comment out the web page includes of the google.chart.service.js file and the Google Visualization API. These will be replaced with the chartjs.chart.service.js file and the Chart.js API. <script src="Scripts/angular.min.js"></script>
<script src="app/app.module.js"></script>
<!-- Google Visualization chart service -->
<!--<script src="/components/dashboard/google.chart.service.js"></script>
<script type="text/javascript" src="https://www.gstatic.com/charts/loader.js"></script>-->
<!-- Chart.js chart service -->
<script src="/components/dashboard/chartjs.chart.service.js"></script>
<script src="/Scripts/Chart.bundle.js" type="text/javascript"></script>
<script src="/components/dashboard/dashboard.component.js"></script>
</body>
Dashboard Rendered with Chart.js
Let's see how things look with our Chart.js chart service rendering chart tiles. When we run the project, this is what we get:

Dashboard with Chart.js chart service
For comparison, below is how the same dashboard looked when the Google chart service was used.

Dashboard with Google Visualization chart service
If you compare the two, you'll see we get good, equivalent (but not identical) charts. We have demonstrated that our chart implementation is truly modular.
A Word on Filling Tiles Well
Filling tiles is tricky. Your tile might get a lot of data to display or a little. A chart tile might get a large number of data points with a large legend, or hardly any data. Your tile needs to do all it can to render well, on all four tile sizes. In the code we've seen so far, we've at times had to use conditions in the template HTML and/or the JavaScript service code to do different things based on tile size.This is even more difficult t when you are using an API to render your tile. For example, the Google Visualization API is really powerful. But, it has eccentricities and the decisions it makes about where to put things and where to leave extra blank space might not mesh well with your expecations. In the charts covered here in Part 2, I easily spent the majority of my time experiementing with parameters in the Google Visualization API in order to gain more control over the placement and appearance of charts--and was only partially successful. There are still some chart tiles in some sizes that aren't great, but I'm limited in how much control I have over what the API does.
Summary
We did quite a bit here in Part 2, including the following:- Implemented a new counter tile.
- Used Angular's ng-if directive to conditionally include markup in the template based on tile type.
- Implemented a new table tile.
- Added a new module, the chart service (google.chart.service.js), and injected it into the dashboard controller.
- Added a custom directive, after-render, so that chart code is called automatically after the template is rendered by Angular.
- Implemented a new donut chart tile using the Google Visualization API.
- Implemented a new column chart tile using the Google Visualization API.
- Added a second edition of ChartService that uses Chart.js (chartjs.chart.service.js), to demonstrate the modularity of depdendency injection and the wisdom of separating chart implementation into a service.
- Implemented donut chart and column chart in the Chart.js chart service.
- Added JQuery UI Touch-Punch so that drag-and-drop will work on mobile devices.
| type | Properties | value | columns | Dependencies |
|---|---|---|---|---|
| counter | label, value | number | N/A | N/A |
| table | columns, value | [ [ row-1 val1, ... valM ], ...[ row-N val1, ... valM ] ] | [ [ heading1, type1 ], ... [headingM, typeM ] ] | N/A |
| donut | columns, value | [ number1, ... numberN ] | [ heading1, ... headingM] ] | ChartService |
| column | columns, value | [ number1, ... numberN ] | [ heading1, ... headingM ] | ChartService |
The dashboard is starting to look real, but there's still much to do. Going forward, we need to:
- More intelligently fill the dashboard area to avoid empty spaces
- Read the tile data from a data source instead of being hard-coded in the JavaScript code
- Use a saved dashboard layout, and persist user modifications to the layout
- Implement tile actions, such as adding a new tile, editing an existing tile, or deleting a tile
In the next lesson, we'll get started on some of these matters.
Download Source
dashboard_02.zip
https://drive.google.com/file/d/0B4734rvcufGGNUpDZ2tpVVZSNkU/view?usp=sharing
dashboard_02.zip
https://drive.google.com/file/d/0B4734rvcufGGNUpDZ2tpVVZSNkU/view?usp=sharing